
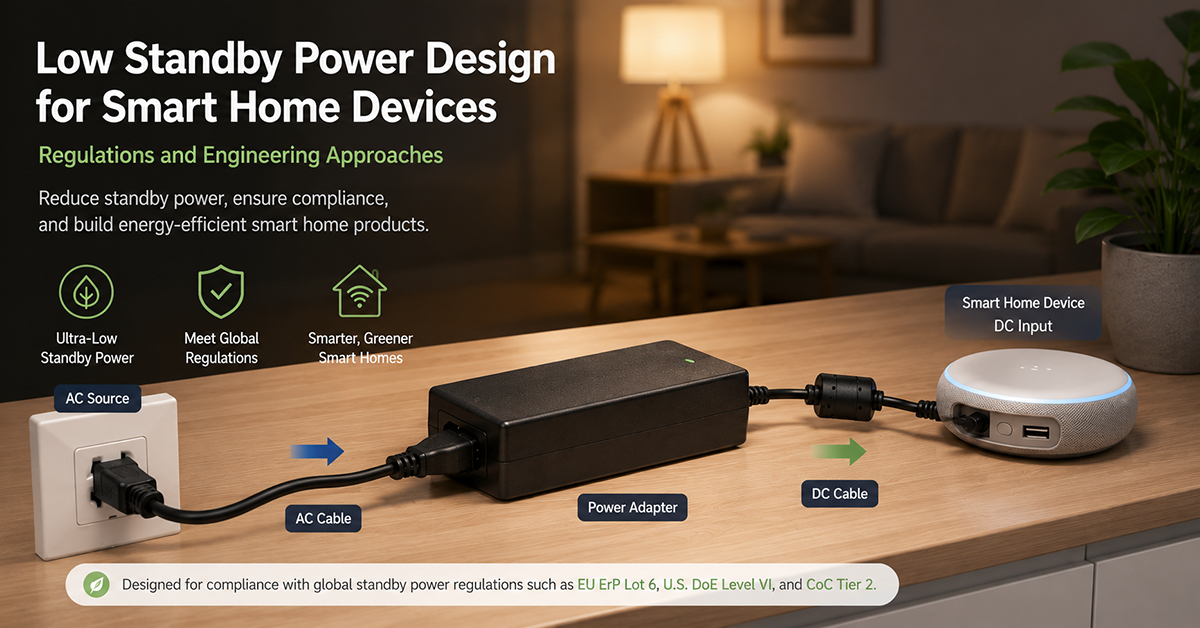
Standby power regulation is tightening globally, and smart home devices—which remain connected to AC power 24/7—are directly affected. A smart speaker, camera hub, or sensor gateway that draws 3W in standby consumes 26 kWh per year, and with hundreds of millions of such devices deployed, the aggregate energy waste is substantial. EU regulations have already reduced standby limits to 1.0W or less, with further reductions to 0.5W coming into effect from 2025.
This guide covers low standby power design for smart home devices: regulatory requirements, the adapter’s contribution to standby power, power management architectures, and practical design strategies for OEMs.
Standby Power Regulations
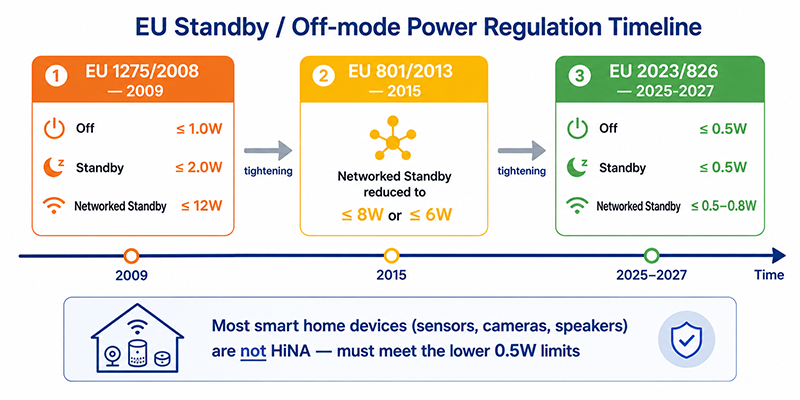
Standby power regulations limit the power a device may consume when not performing its primary function. The applicable limits depend on the device type, market, and whether the device maintains a network connection in standby.
| Market | Regulation | Limits | Effective | Scope |
|---|---|---|---|---|
| EU | EU 1275/2008 | Off mode: ≤1.00W, Standby: ≤2.00W, Networked standby: ≤12.00W | 2009 | Household and office equipment |
| EU | EU 801/2013 | Networked standby reduced to ≤8.00W (information equipment) or ≤6.00W (other) | 2015 | Amends 1275/2008 |
| EU | EU 2023/826 | Off mode: ≤0.50W, Standby: ≤0.50W, Networked standby: ≤0.50–0.80W (HiNA: ≤6.00–7.00W) | 2025–2027 | Replaces 1275/2008 for most products |
| USA | Energy Star | Varies by product category (typically 0.5–2.0W standby) | Ongoing | Voluntary |
| USA | CEC Title 20 | External power supplies ≤0.50W standby | 2007 | California only |
| Global | IEC 62301 | Measurement standard for standby power | — | Defines test method |
Key Changes in EU 2023/826 (Effective 2025–2027)
| Parameter | Previous Limit (1275/2008) | New Limit (2023/826) |
|---|---|---|
| Off mode | ≤1.00W | ≤0.50W |
| Standby (no network) | ≤2.00W | ≤0.50W |
| Standby with network connection | ≤8.00–12.00W (depending on product type) | ≤0.50–0.80W (standard) / ≤6.00–7.00W (HiNA) |
| Power management required | Default time to standby ≤30 min | Default time to standby ≤20 min |
HiNA (High Network Availability) devices include network switches, routers, and modems that must maintain network connectivity. Most smart home devices (sensors, cameras, speakers) are not classified as HiNA and must meet the lower limits.
Why This Matters
- EU 2023/826 reduces standby limits from 1.0–2.0W to 0.5W for most devices. Products exceeding these limits cannot be legally sold in the EU after the effective dates.
- The new standby limits apply to the complete device, including the adapter’s no-load consumption and the device’s idle power draw.
- Networked standby limits are now much closer to off-mode limits. A smart home device that maintains a network connection can no longer justify 8W of standby power.
OEM Actions
- Determine the effective date of EU 2023/826 for your product category and plan design changes to meet the new limits.
- Measure standby power at the AC input of the complete device (adapter + product) using the IEC 62301 test method.
- Verify that the device’s power management system enters the appropriate low-power state within the required time limit (≤20 minutes default).
The Adapter’s Contribution to Standby Power
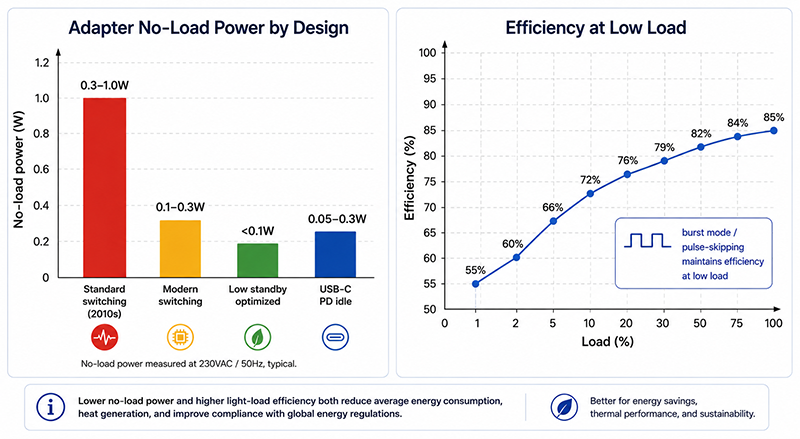
The external power adapter contributes to the device’s standby power in two ways: no-load power consumption and conversion efficiency at low load.
No-Load Power Consumption
| Adapter Design | Typical No-Load Power | Notes |
|---|---|---|
| Standard switching adapter (2010s design) | 0.3–1.0W | Older flyback designs with no standby optimization |
| Modern switching adapter (efficient) | 0.1–0.3W | Improved control ICs, burst mode operation |
| Low standby adapter (optimized) | <0.1W | Advanced burst mode, high-voltage startup, efficient snubber |
| USB-C PD adapter (idle) | 0.05–0.3W | Varies by design; idle with no load connected |
Efficiency at Low Load
Adapter efficiency decreases at very low loads. A typical adapter may achieve 85% efficiency at full load but only 50–60% efficiency at 1% load. This means the adapter’s internal losses consume a significant portion of the standby power budget.
Total Standby Power Calculation
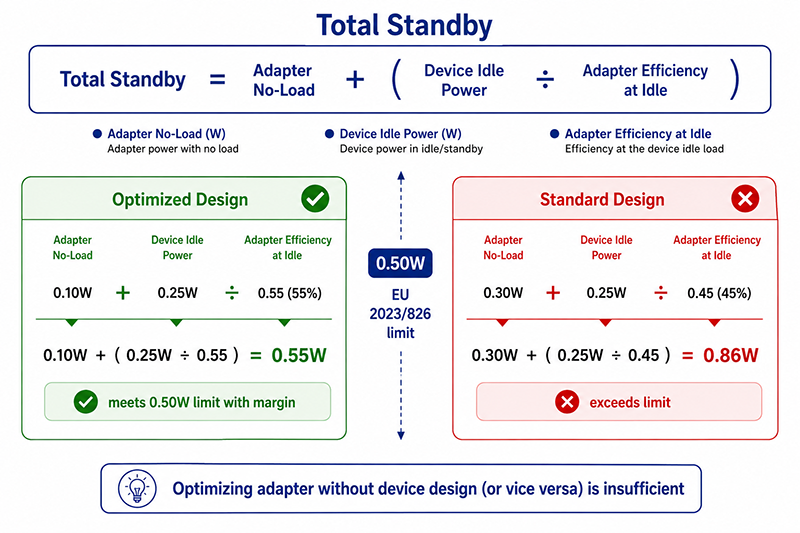
Total standby power = Adapter no-load + (Device idle power / Adapter efficiency at idle load)
Example:
- Adapter no-load: 0.10W
- Device idle power: 0.25W
- Adapter efficiency at 0.25W load: 55%
- Total standby: 0.10W + (0.25W / 0.55) ≈ 0.10W + 0.45W = 0.55W
This example meets the 0.50W limit only if both the adapter no-load and the device idle power are optimized. Without optimization, a standard adapter (0.30W no-load, 45% efficiency at low load) would consume 0.30W + (0.25W / 0.45) ≈ 0.86W, exceeding the limit.
Why This Matters
- The adapter’s no-load power consumption directly subtracts from the device’s standby power budget. Every 0.1W of no-load power reduces the available budget by 0.1W.
- Adapter efficiency at low load matters more for standby than full-load efficiency. An adapter optimized for standby will have burst mode or pulse-skipping operation at low loads.
- Meeting the 0.50W standby limit requires both a low-standby adapter and a low-power device design. Optimizing one without the other is insufficient.
OEM Actions
- Request no-load power data from adapter suppliers at the device’s expected standby voltage and current. No-load power is voltage-dependent.
- Select adapters with burst mode or pulse-skipping operation for low-load efficiency. Verify the efficiency at the device’s standby power level, not just at full load.
- Measure the complete system (adapter + device) standby power using the IEC 62301 test method. The adapter’s contribution cannot be calculated from datasheet values alone.
Power Management Architectures for Low Standby
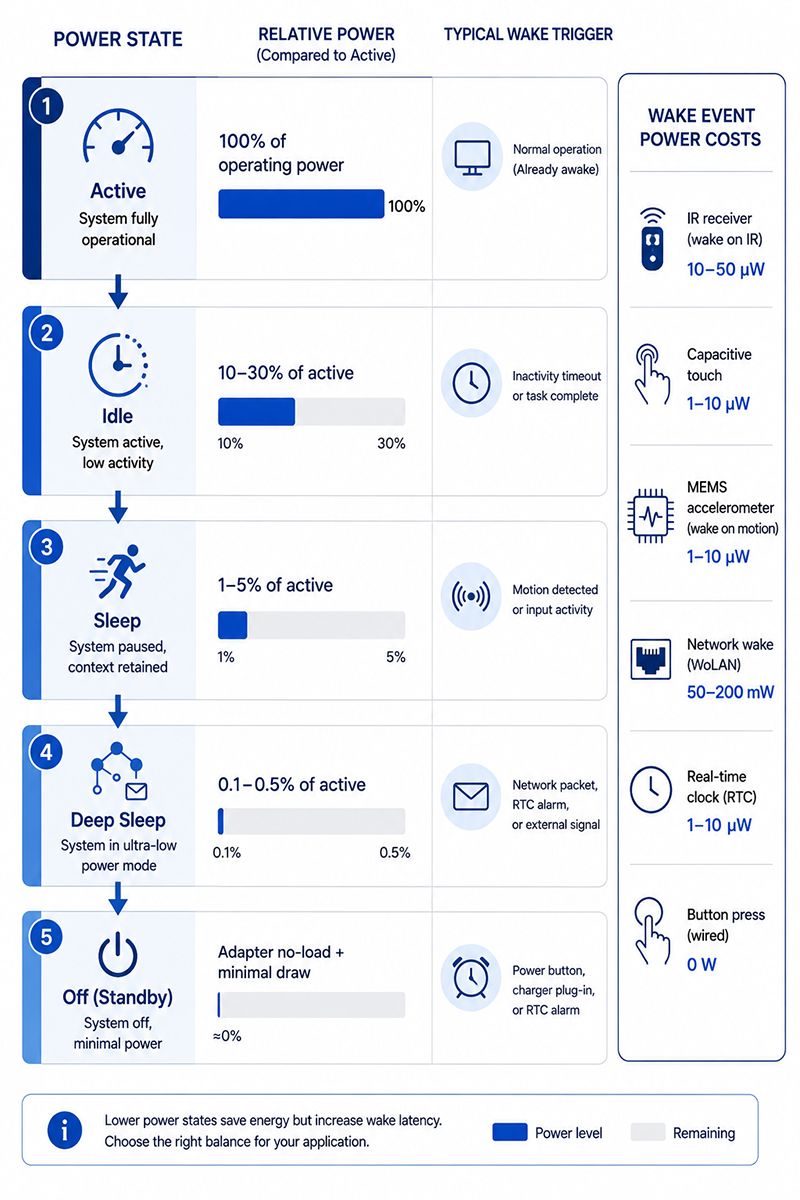
Effective power management in smart home devices requires the ability to enter low-power states while maintaining the ability to wake on specific events.
Power State Architecture
| State | Description | Power Consumption | Wake Trigger |
|---|---|---|---|
| Active | Device performing primary function | 100% of operating power | — |
| Idle | Primary function inactive, all subsystems powered | 10–30% of active power | Timer or user interaction |
| Sleep | Non-essential subsystems powered off | 1–5% of active power | Motion, sound, network activity |
| Deep sleep | Only wake-event monitor powered | 0.1–0.5% of active power | Specific trigger (network packet, button) |
| Off (standby) | AC adapter connected, device in lowest state | Adapter no-load + minimal device draw | Hard wake (button, power cycle) |
Wake-on-Event Design
Low standby power requires the device’s main processor and peripherals to be powered off while a low-power wake monitor remains active. Common wake event sources:
- IR receiver (remote control wake): ~10–50µW
- Capacitive touch sensor: ~1–10µW
- MEMS accelerometer (motion wake): ~1–10µW
- Network activity detect (WoLAN): ~50–200mW (requires network interface powered)
- Real-time clock (timed wake): ~1–10µW
- Button press (hardware interrupt): ~0W (no monitoring power needed)
Power Supply Sequencing
The power supply must support different power states efficiently. Strategies include:
- Always-on low-power rail: A small, efficient DC-DC converter powers the wake monitor continuously
- Switched main rail: A load switch or second DC-DC converter supplies the main processor and peripherals only when active
- Adapter voltage pass-through: In sleep state, the adapter directly powers the always-on rail without intermediate conversion losses
Why This Matters
- A device that cannot enter deep sleep because the wake monitor draws too much power will not meet the 0.50W standby limit regardless of adapter selection.
- Wake-on-network (keeping the network interface alive) is the largest contributor to standby power in connected devices. A network interface consuming 200mW dominates the 500mW standby budget.
- The power management architecture must be designed for the target standby power limit from the specification stage, not added as an afterthought.
OEM Actions
- Define the required power states and wake events for the device. Determine the minimum set of circuits that must remain powered in each state.
- Select the lowest power wake monitor that meets the device’s responsiveness requirements. For sensors, a motion-triggered wake is typically acceptable. For voice assistants, always-on microphone wake may require higher standby power.
- Design the power supply architecture to support multiple power states with efficient transition between states.
Design Strategies for Meeting Standby Limits
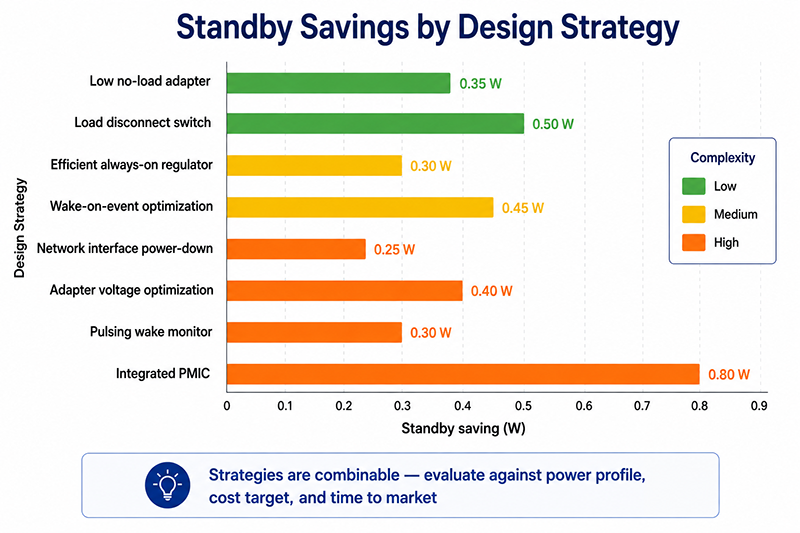
The following design strategies can help smart home OEMs meet tightening standby power limits:
| Strategy | Standby Saving | Implementation Complexity | Notes |
|---|---|---|---|
| Low no-load adapter | 0.2–0.4W | Low (adapter selection) | Specify <0.1W no-load adapter |
| Load disconnect switch | 0.2–0.5W | Low (FET + GPIO) | Removes power from main circuits in standby |
| Efficient always-on regulator | 0.05–0.3W | Medium (DC-DC selection) | Replace LDO with DC-DC for always-on rail |
| Wake-on-event optimization | 0.1–0.5W | Medium (sensor selection) | Select lowest-power wake sensor that meets response time |
| Network interface power-down | 0.1–0.8W | Medium (software) | Power-down Wi-Fi/BT when not needed; wake on event |
| Adapter voltage optimization | 0.05–0.15W | Low (voltage selection) | Match adapter voltage to minimize conversion losses at low load |
| Pulsing wake monitor | 0.05–0.1W | Medium (firmware) | Sample sensor periodically instead of continuous monitoring |
| Integrated PMIC | 0.1–0.5W | High (IC selection, PCB redesign) | Dedicated power management IC coordinates states |
Not all strategies are applicable to every device. The combination of strategies should be evaluated based on the device’s power profile, cost target, and time to market.
Useful Links
Related article: Smart Home Power Supply Selection Guide →
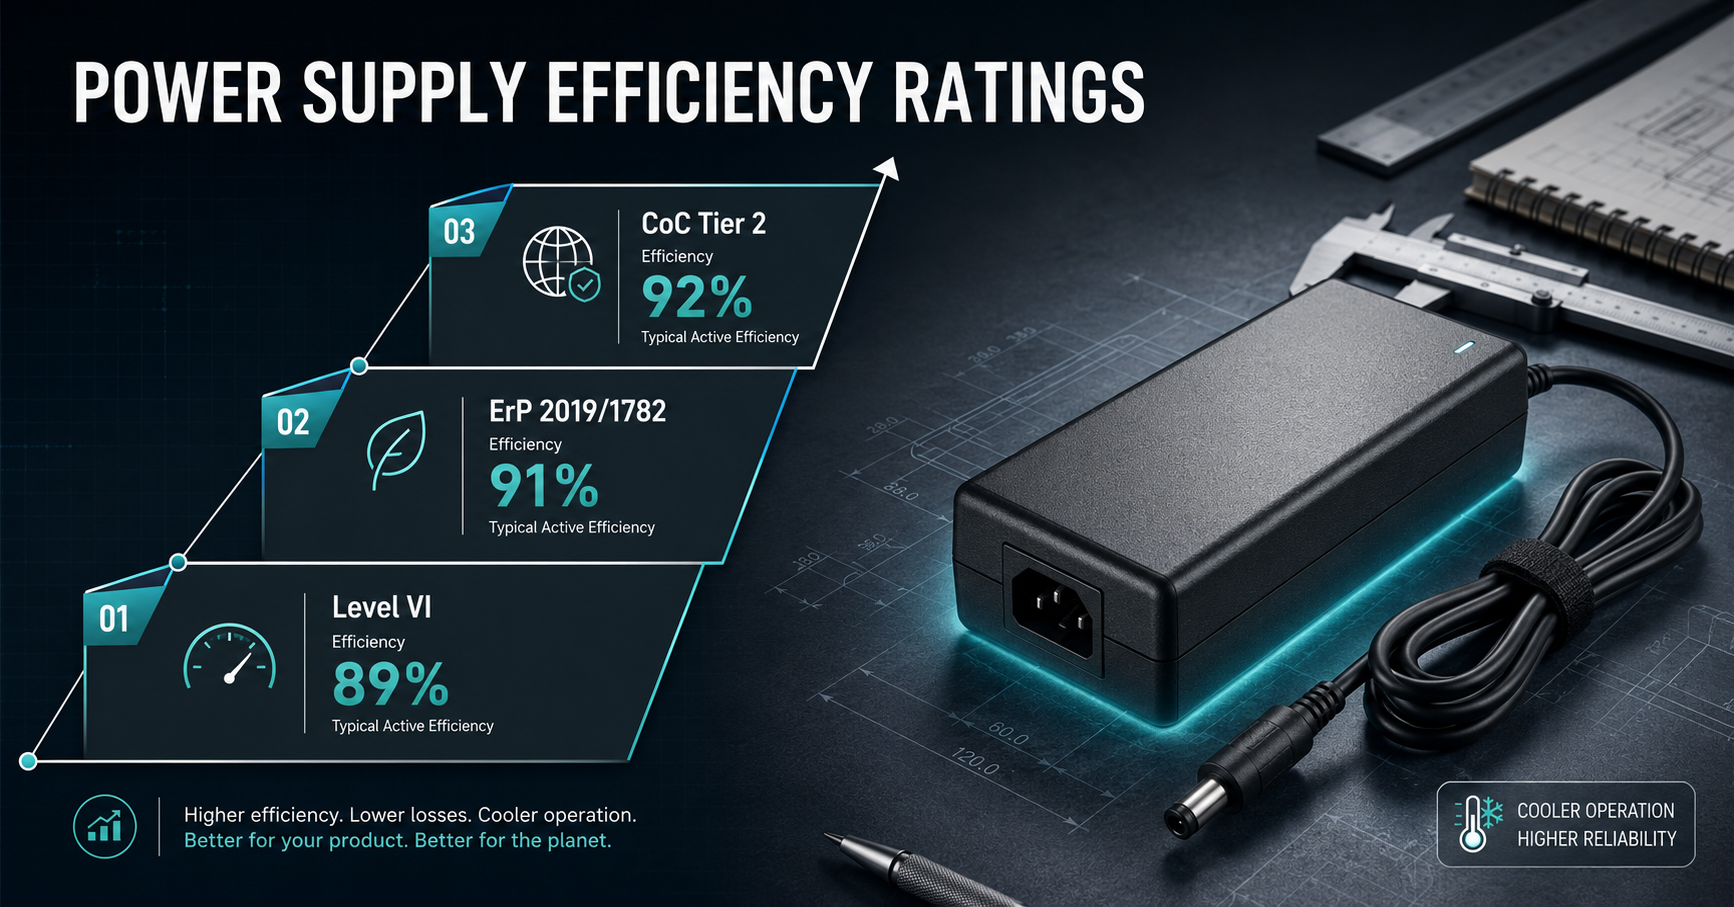
Related article: Power Supply Efficiency Ratings →
Q: How low can standby power realistically go for a Wi-Fi-connected smart home device?
A: With optimized design, a Wi-Fi-connected smart home device can achieve 0.3–0.5W standby by using a low-no-load adapter, efficient DC-DC converters, and powering down the Wi-Fi module between periodic check-ins (beacon mode). Always-on Wi-Fi (DTIM mode) typically requires 50–200mW just for the radio, plus adapter overhead.
Q: Does a USB-C PD adapter have lower standby power than a dedicated adapter?
A: Not necessarily. USB-C PD adapters vary widely in no-load power. A low-standby USB-C adapter may achieve 0.05–0.10W no-load, while a standard one may consume 0.15–0.30W. The adapter should be selected for its standby performance regardless of connector type.
Q: What is the most effective single change for reducing standby power?
A: Selecting an adapter with <0.1W no-load power is often the most cost-effective single change. All other internal power reductions are multiplied by the adapter's standby efficiency, so starting with a low-standby adapter provides the best foundation.
Conclusion
Low standby power design for smart home devices requires a system-level approach combining a low-no-load adapter, efficient power management architecture, and appropriate wake-on-event design. EU regulations (EU 2023/826) are driving standby limits down to 0.50W, making adapter selection and power state architecture design critical for market access. The key strategies are: selecting adapters with <0.1W no-load power, designing power states that enter deep sleep when idle, optimizing wake-on-event power, and measuring complete system standby power using the IEC 62301 test method.
Related Resources
🔌 Related Products
🏭 Related Applications
📖 Related Guides
Smart Home Selection Guide
Cluster gateway: power selection for IoT device OEMs
Read Guide →
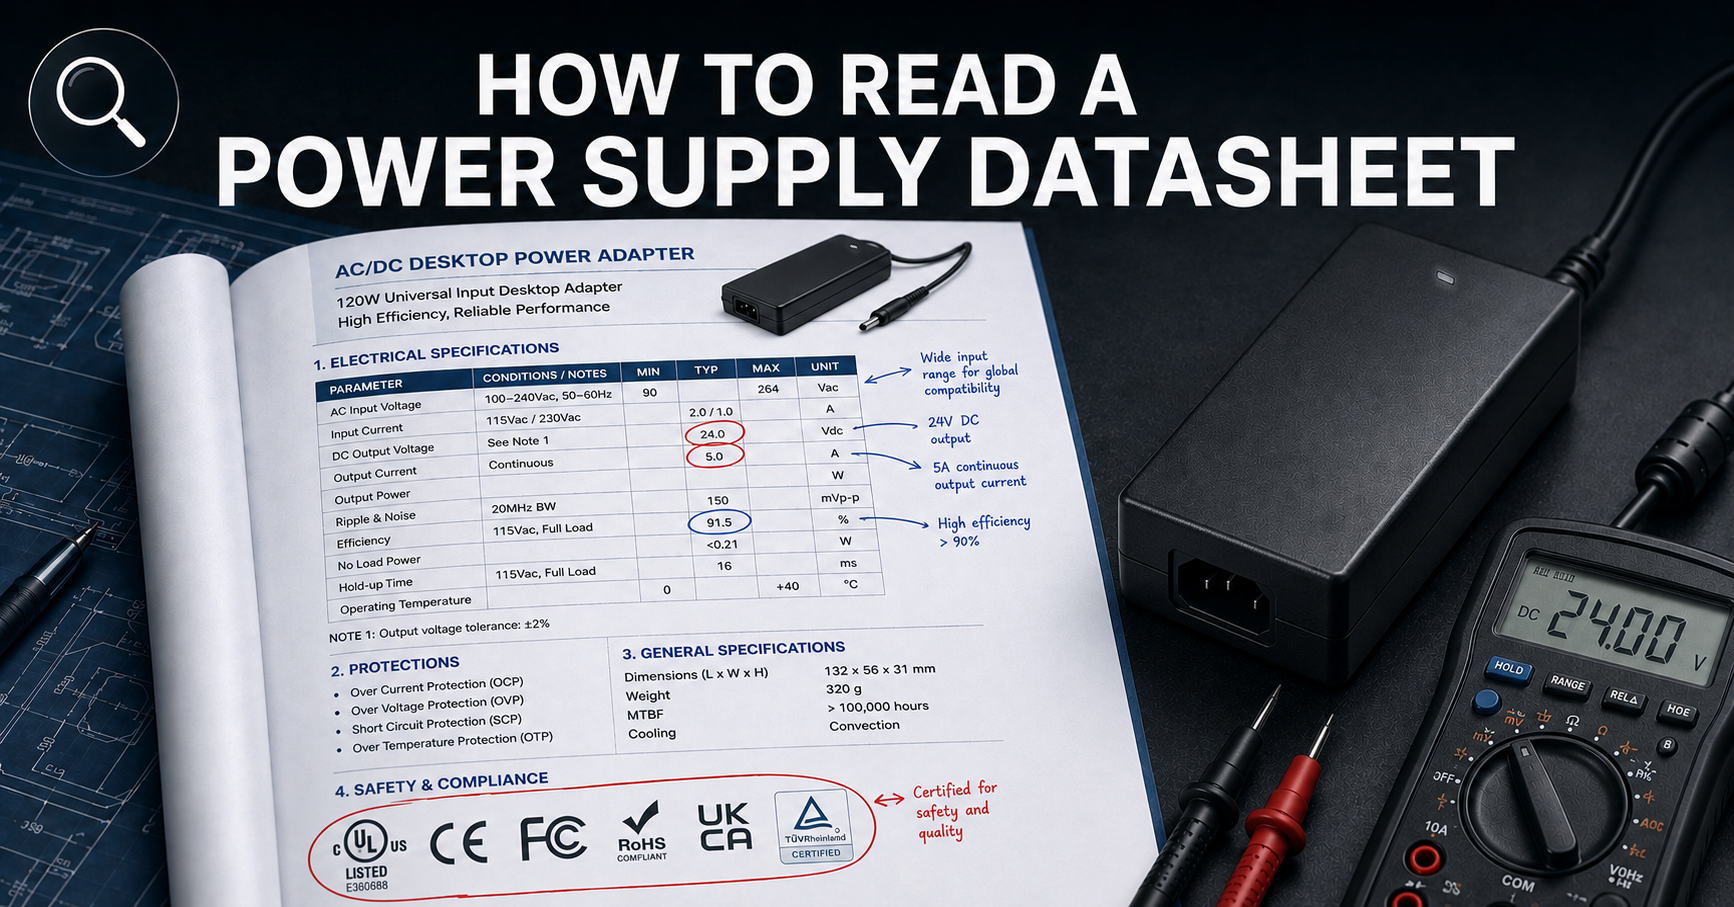
How to Read a Power Supply Datasheet
Learn how to evaluate connector specifications in a datasheet — current ratings, derating curves, certification verification.
✅ Related Certifications
UL 62368-1 Safety Certification
Safety standard covering connector creepage/clearance, temperature rise, and strain relief requirements for IT/AV equipment power adapters.