
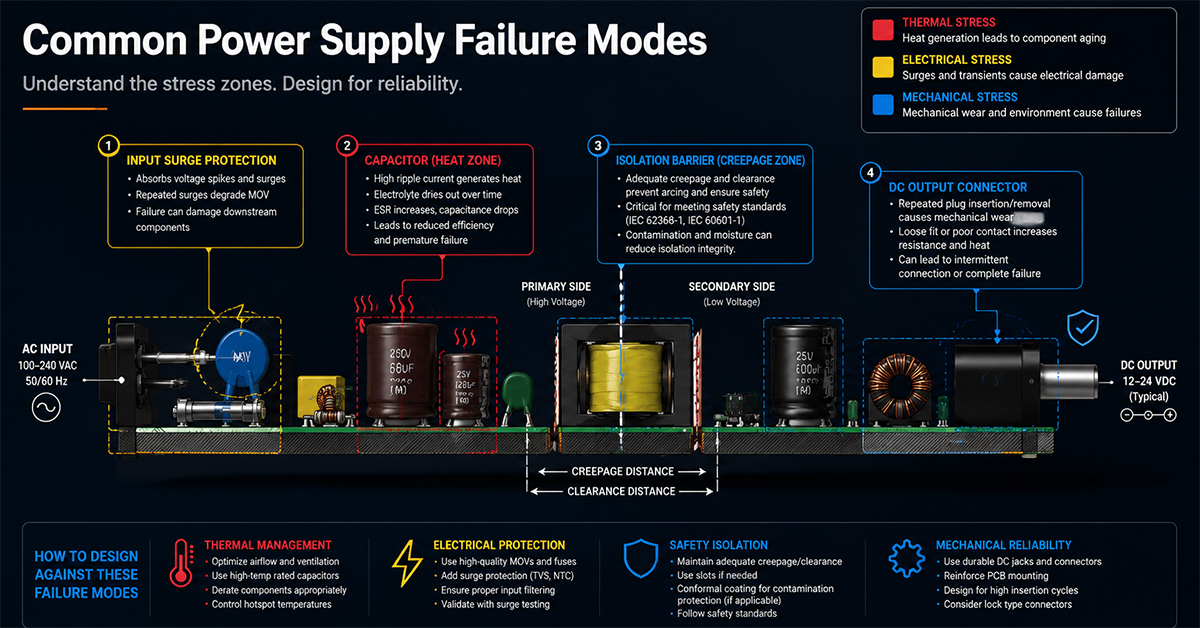
Why Understanding Failure Modes Matters in OEM Design
When a power supply fails in the field, the symptom—equipment that won’t power on, intermittent resets, or smoke from the enclosure—is usually the end-stage of a degradation process that began months earlier. Most power supply failures are not random events. They follow predictable mechanisms driven by electrical, thermal, and environmental stressors that can be anticipated and mitigated during the design phase.
For OEM design engineers, understanding these failure modes is critical for three reasons:
- Field failure rate drives warranty cost. A 1% increase in annual power supply failure rate on a product shipping 10,000 units per year translates to 100 warranty replacements, each costing 50–200 in logistics, labor, and parts.
- Failure mode determines countermeasure. A capacitor failing from ripple current is solved differently than one failing from ambient heat. Treating all failures as “bad components” misses the root cause.
- Design margins are the cheapest insurance. Adding 20% voltage margin to a bulk capacitor costs pennies at BOM time but prevents weeks of field returns.
This guide catalogs the most common power supply failure modes across AC/DC adapters, open-frame supplies, and battery chargers—with the root causes, diagnostic indicators, and engineering countermeasures you can apply during specification and design review.
🛠️ Engineering Tip: Start a “failure mode log” during product development. Every time a prototype supply fails during qualification testing, record the failure mechanism, the stress condition, and the fix. After three products, you will have a personalized derating guide tailored to your applications.
Bathtub Curve: The Three Phases of Product Reliability
| Stage | Typical Condition | Example Indicators | Recommended Action |
|---|---|---|---|
| 🟢 Stage 1 Initial Stress | Components operate within specification but are exposed to electrical, thermal, mechanical, or environmental stress. | • High ambient temperature • Input voltage fluctuations • Mechanical vibration • High humidity | Apply proper derating, improve thermal design, reduce environmental stress, and verify design margins. |
| 🟡 Stage 2 Measurable Degradation | Electrical characteristics begin drifting while the power supply still functions normally. | • ESR +10% • Output ripple +20% • Efficiency drop 2–5% • Component temperature increases | Perform preventive maintenance, monitor critical parameters, and replace aging components before further deterioration. |
| 🟠 Stage 3 Early Warning Signs | Performance degradation becomes noticeable and reliability decreases. | • Output ripple 2× baseline • Output voltage fluctuation • Audible coil whine • Protection circuits trigger more frequently | Investigate the root cause immediately, inspect key components, and schedule repair or replacement. |
| 🔴 Stage 4 Catastrophic Failure | The power supply can no longer operate safely or deliver rated output. | • Complete loss of output • Smoke or burning smell • Component rupture or short circuit • Permanent shutdown | Remove from service immediately, perform failure analysis, and replace the power supply. |
Failure Timeline: The Predictable Path to Catastrophic Failure
| Stage | Failure Progression | Status | Typical Physical Change | Example Indicators | Engineering Interpretation |
|---|---|---|---|---|---|
| 1 | Initial Stress | 🟢 Normal Operation Under Stress | Components operate normally but experience continuous electrical, thermal, or mechanical stress | • Ambient temperature rise +5°C • Load increase +10% • Long operating hours / high duty cycle | Stress accumulation begins. No obvious performance loss yet, but component lifetime is being consumed. |
| 2 | Measurable Degradation | 🟡 Parameter Drift Begins | Component characteristics start shifting beyond original values while still within operating limits | • ESR +10% • Capacitance -8% • DCR +12% • Leakage current +15% | Aging becomes measurable through electrical testing and reliability monitoring. |
| 3 | Early Warning Signs | 🟠 Performance Instability | Degradation creates detectable abnormal behavior before complete failure | • Output ripple 2× baseline • Harmonic distortion >5% • Hotspot temperature +15°C • Intermittent output fluctuation | System shows warning signals. Preventive maintenance or replacement should be considered. |
| 4 | Catastrophic Failure | 🔴 Functional Loss | Component failure causes system shutdown or safety protection activation | • Output voltage loss • Overcurrent protection trip • Complete loss of function • Permanent damage | End-of-life condition. Power supply or system can no longer meet required performance. |
| Failure Mode | Primary Cause | Telltale Signs | Key Countermeasure | Risk Priority |
|---|---|---|---|---|
| Electrolytic Capacitor Aging | High operating temperature, ripple current stress, long service time | Increased ESR, higher ripple voltage, output instability | Improve thermal design, use higher temperature capacitors, derating | 5 |
| Input Surge Protection Failure | Repeated voltage surges, lightning events, MOV degradation | Burn marks, fuse opening, no power output | Proper MOV selection, fuse coordination, surge testing | 5 |
| Thermal Overstress | Poor ventilation, excessive load, insufficient heat dissipation | Case temperature rise, thermal shutdown, reduced lifetime | Improve airflow, add heatsinking, apply power derating | 4 |
| Isolation Barrier Degradation | Insulation aging, contamination, insufficient creepage distance | Safety test failure, leakage increase, insulation breakdown | Maintain creepage/clearance distance, conformal coating, safety review | 4 |
| Connector & Cable Wear | Mechanical stress, repeated mating cycles, vibration | Intermittent output, loose connection, voltage drop | Select locking connectors, improve strain relief, optimize cable gauge | 3 |
| Component Solder Joint Fatigue | Thermal cycling, vibration, mechanical stress | Intermittent failure, visible cracks, unstable operation | Improve PCB design, solder process control, vibration testing | 3 |
| Control IC / Semiconductor Failure | Overvoltage, overheating, electrical overstress | Sudden shutdown, abnormal output voltage, complete failure | Protection circuits, component margin design, reliability testing | 2 |
Section 1: Capacitor Degradation — The #1 Cause of Power Supply Failure
Capacitors—particularly electrolytic capacitors—account for an estimated 40–60% of all power supply failures in field-return analysis. They are simultaneously the most stressed and most life-limited component in any AC/DC converter.
Engineering Case Study: Electrolytic Capacitor Life in Medical Monitors
Background: A medical equipment OEM was experiencing a 4.7% annual field failure rate on their patient monitor power adapters after 18–24 months of deployment. Failure analysis consistently showed bulged output capacitors with elevated ESR. The symptom was intermittent monitor resets, escalating to complete power loss.
Root cause investigation: The adapters used 1,000-hour-at-105 °C rated output capacitors. At 40 °C internal ambient (measured inside the monitor enclosure during summer peak), the expected life of these capacitors was approximately 18,000 hours — just over 2 years of continuous hospital operation. The derating was fundamentally inadequate for a medical device expected to operate 24/7 for 5–7 years.
Solution applied: The OEM switched to 8,000-hour-at-105 °C rated capacitors (same case size, different electrolyte formulation) and improved enclosure ventilation, reducing internal ambient by 5 °C.
Result: The annual field failure rate dropped from 4.7% to 0.3%. The additional BOM cost per adapter was 0.18.At15,000unitsshippedannually,thecostincreasewas2,700 per year — compared to an estimated $120,000 per year in warranty replacement costs at the previous failure rate.
Takeaway: A $0.18 BOM change eliminated a 4.7% failure rate. The capacitor life calculation during design review would have caught this before production.
1.1 Electrolytic Capacitor Drying (ESR Rise)
Failure mechanism: Aluminum electrolytic capacitors contain a liquid electrolyte that slowly evaporates over time. The evaporation rate is governed by operating temperature and ripple current. As the electrolyte dries, equivalent series resistance (ESR) rises, increasing internal heating, which accelerates drying. This thermal runaway eventually causes the capacitor to lose capacitance, bulge its vent, or short-circuit.
Root causes:
- Operating near or above rated temperature (85 °C or 105 °C rated caps running at 70 °C+ ambient)
- High ripple current exceeding capacitor ripple rating
- Poor thermal coupling to PCB or enclosure
- Low-quality capacitors with insufficient electrolyte volume
Diagnostic indicators:
- Bulged or cracked capacitor vent (visible)
- Output ripple increasing over time (measured during PM)
- Brown electrolyte residue around the capacitor base
- Supply fails at high ambient temperature but works when cool
Engineering countermeasures:
- Derate operating temperature: For every 10 °C reduction below the capacitor’s maximum rated temperature, expected life doubles. Select 105 °C rated capacitors and design for ≤ 75 °C internal ambient.
- Reduce ripple stress: Choose capacitors with ripple current rating ≥ 1.5× the calculated ripple in the application.
- Parallel capacitors: Use two smaller capacitors in parallel instead of one large one. This halves the ripple current per device and provides redundancy.
- Specify long-life types: Use 5,000–10,000 hour rated capacitors at 105 °C (rather than standard 1,000–2,000 hour types) for mission-critical designs.
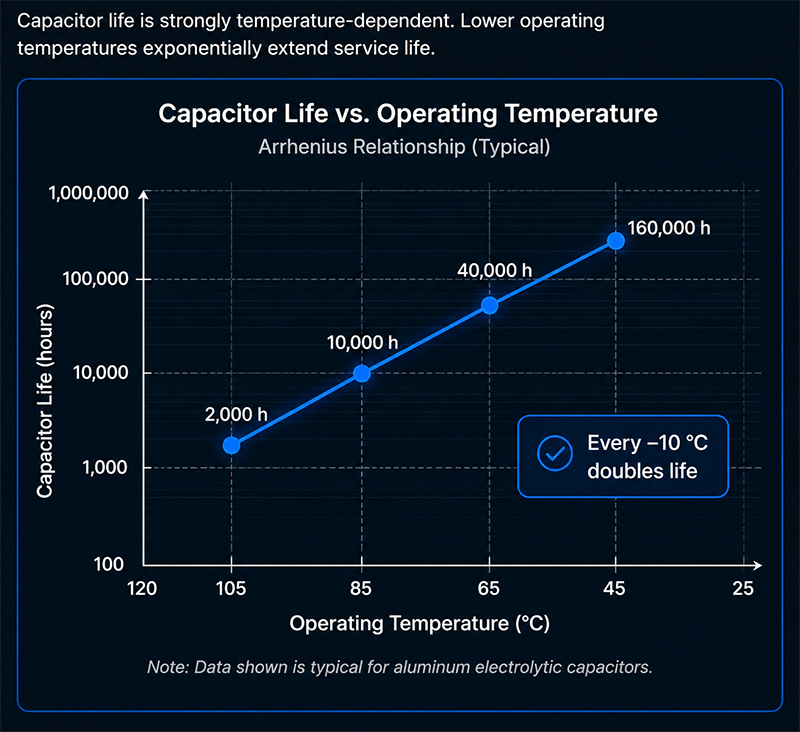
🛠️ Engineering Tip: Request “capacitor life calculation” from your power supply vendor as part of the design review. A good vendor can provide calculated lifetime at your specific operating temperature and load profile using the Arrhenius model. YHYadapter provides this data for all custom OEM designs.
1.2 Ceramic Capacitor Cracking
Failure mechanism: MLCCs (multilayer ceramic capacitors) used for input/output filtering can develop microcracks from mechanical stress—PCB flex during assembly, thermal shock during soldering, or vibration in the field. These cracks can cause intermittent shorts or leakage paths.
Root causes:
- PCB flex near breakaway tabs or mounting holes
- Rapid temperature changes during wave soldering
- Large case sizes (1206, 1210) more prone to flex cracking
- High-K dielectrics (X7R, Y5V) with piezoelectric effects under AC voltage
Engineering countermeasures:
- Use smaller case sizes (0805 or 0603) where possible for MLCCs near board edges
- Specify soft-termination or flexible-termination MLCCs for applications with known vibration or flex
- Add series resistance (a few ohms) to dampen inrush into ceramic input capacitors
- Limit voltage derating — operate ceramic caps at ≤ 50% of rated voltage to reduce DC bias capacitance loss and mechanical stress
Section 2: Thermal Stress — The Accelerator of Every Other Failure
Heat is not a failure mechanism itself—it is a force multiplier that accelerates every other degradation mechanism. The Arrhenius equation dictates that for many chemical processes (electrolyte evaporation, semiconductor diffusion, solder creep), the reaction rate doubles for every 10 °C temperature rise.
2.1 Semiconductor Junction Overstress
Failure mechanism: MOSFETs, diodes, and control ICs have a maximum junction temperature (typically 125 °C or 150 °C). Sustained operation near the limit accelerates electromigration in bond wires, gate oxide degradation in MOSFETs, and solder fatigue in surface-mount packages.
Root causes:
- Inadequate heatsinking for the enclosure type
- Poor airflow in sealed or compact equipment
- Output load exceeding the supply’s thermal derating curve
- High ambient temperature in the end-equipment environment
- Repeated thermal cycling causing solder joint fatigue
Engineering countermeasures:
- Demand thermal derating curves during vendor selection. A good supply delivers full rated power up to 40–50 °C ambient with linear derating above that.
- Design for thermal margin: Select a power supply rated at least 20–30% above the maximum continuous load. Operating at 70% of rated power typically results in 15–20 °C lower internal temperature than operating at 90%.
- Use forced-air configurations for enclosed designs. Even low-velocity airflow (0.5–1.0 m/s) can reduce internal hot-spot temperatures by 10–15 °C compared to natural convection.
- Thermal imaging during prototype validation: Use a thermal camera to identify hot spots during full-load burn-in. Components exceeding 85 °C surface temperature in a 40 °C ambient should be reviewed for design margin.
2.2 Transformer and Inductor Saturation
Failure mechanism: Magnetic components (transformers, output inductors, PFC chokes) saturate when the magnetic flux density exceeds the core material’s saturation limit (typically 0.3–0.5 T for ferrite). Saturation causes a sharp drop in inductance, resulting in current runaway, overheating, and eventual failure.
Root causes:
- DC current bias exceeding the inductor’s rated saturation current
- Transient overload conditions (motor start, capacitive load, short-duration peaks)
- Core temperature rise reducing saturation flux density (ferrite loses ~10–15% saturation capability between 25 °C and 100 °C)
- Manufacturing variation in core air gap
Engineering countermeasures:
- Specify inductors with ≥ 20% saturation current margin above maximum peak current
- Use gapped cores for DC-biased applications—distributed-gap materials (iron powder, sendust) have soft saturation characteristics compared to ferrite
- Implement current-mode control in the converter design to limit peak current on a cycle-by-cycle basis
- Validate saturation at worst-case temperature: Test at maximum ambient temperature and maximum load simultaneously
Section 3: Input Surge and Transient Overvoltage
AC mains power is inherently noisy. Lightning strikes, utility switching, motor starts, and generator transitions all produce voltage transients that reach the input of your power supply. While international standards define immunity levels, many field failures trace back to surges that exceeded the protection design margin.
3.1 Differential-Mode Surge Damage
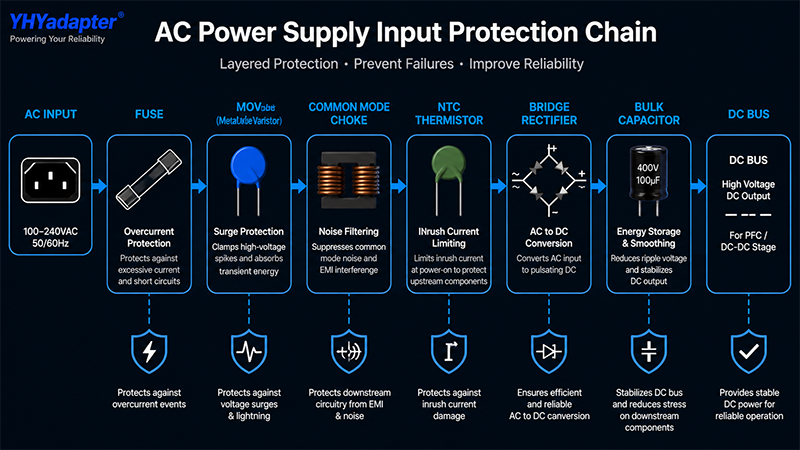
Failure mechanism: A differential surge (between line and neutral) propagates through the input rectifier and into the bulk capacitor. If the surge energy exceeds the MOV (metal oxide varistor) clamping voltage rating or the bulk capacitor’s peak voltage rating, the capacitor can rupture or the rectifier diodes can short.
Root causes:
- MOV rated for insufficient energy absorption (Joules)
- Bulk capacitor voltage rating too close to peak rectified voltage (e.g., 400 V cap on 264 VAC input where peak is 373 V)
- No fuse or PTC inrush limiting ahead of the rectifier
- Cumulative MOV degradation from multiple small surges
Engineering countermeasures:
- Match MOV rating to application environment: For industrial equipment, use 20 mm MOVs with ≥ 200 J energy rating. For protected indoor environments, 14 mm / 100 J MOVs are adequate.
- Derate the bulk capacitor voltage: Use 450 V rated electrolytics for universal-input (90–264 VAC) designs, not 400 V. The 50 V margin provides significant reliability headroom.
- Add series impedance: A negative-temperature-coefficient (NTC) thermistor limits inrush and provides some surge damping.
- Consider multi-stage protection: MOV + fusible resistor + common-mode choke provides better surge management than MOV alone.
🛠️ Engineering Tip: For mission-critical outdoor or industrial applications, specify surge protection that meets IEC 61000-4-5 Level 4 (±4 kV line-to-line, ±4 kV line-to-ground) rather than the typical Level 2 (±1 kV / ±2 kV). The cost difference in protection components is minimal; the field reliability difference is significant.
3.2 Common-Mode Surge and Insulation Breakdown
Failure mechanism: A common-mode surge (between line/neutral and ground/protective earth) stresses the isolation barrier—the transformer insulation, optocoupler creepage distance, and PCB clearance. Repeated or high-energy common-mode surges can cause arc tracking across the PCB, insulation breakdown in the transformer, or optocoupler CTR (current transfer ratio) degradation.
Root causes:
- Inadequate creepage distance for the working voltage class (e.g., < 8 mm for 250 VAC reinforced insulation per IEC 62368-1)
- PCB contamination or humidity reducing effective creepage
- Y-capacitor degradation or open-circuit (Y-caps provide a low-impedance path for common-mode energy)
- Transformer inter-winding insulation not rated for the required impulse voltage
Engineering countermeasures:
- Maintain ≥ 8 mm creepage on the primary-secondary boundary for reinforced insulation at 250 VAC working voltage
- Use triple-insulated wire for transformer secondary windings in compact designs where physical creepage is constrained
- Specify Y-capacitors rated for the application class (Y1 for double/reinforced insulation, Y2 for basic insulation) and include capacitance monitoring in production test
- Add spark gaps or gas discharge tubes across the isolation barrier for high-energy surge environments
Need help evaluating surge protection for your application?
Our engineering team can review your input protection requirements.
Section 4: Output Overload and Short-Circuit Stress
Power supply overload protection is standard, but the difference between a protection circuit that saves the supply and one that contributes to its failure often comes down to design margin.
4.1 Hiccup-Mode Fatigue
Failure mechanism: Many power supplies use “hiccup mode” for short-circuit protection—the supply attempts to restart periodically (every few hundred milliseconds) and shuts down again if the fault persists. While this protects against sustained overload, the repeated high-energy inrush into the output capacitors and switching devices during each restart cycle can stress the output rectifiers and capacitors beyond their intended cycle life.
Root causes:
- Fault condition that persists for hours or days (e.g., damaged cable, shorted load)
- High output capacitance causing large inrush current at each hiccup restart
- Output diode voltage stress at each restart near reverse recovery maximum
- No limit on hiccup restart count
Engineering countermeasures:
- Specify “latch-off” or “auto-restart with delayed retry” protection for applications where persistent short circuits are possible. A 30-second retry interval (vs. 500 ms) dramatically reduces cumulative stress.
- Request the hiccup transient waveform from the vendor during design review—verify that the peak MOSFET drain current during hiccup restart does not exceed the Rds(on) rating.
- Design the load interface to prevent sustained short circuits at the power connector (use fused or current-limited load-side wiring).
4.2 Output Capacitor Ripple Overstress
Failure mechanism: Even under normal operation, output capacitors experience AC ripple current at the switching frequency (typically 65–200 kHz). The ripple current causes internal I²R heating in the capacitor. When the output filtering is marginal or the load draws high-frequency pulsed current, ripple current can exceed the capacitor rating.
Root causes:
- Cost-optimized designs with minimal output capacitance
- Pulsed load profiles (e.g., motors, solenoids, thermal printers)
- High switching frequency requiring ultra-low-ESR output capacitors
- Load current near maximum rating combined with high ripple voltage specification
Engineering countermeasures:
- Verify output ripple current specification against your actual load profile. Standard datasheets specify ripple at nominal load and nominal input—your application may need to request additional data.
- Add local bulk capacitance at the load rather than relying solely on the power supply’s output capacitors. Adding 100–470 µF at the load entry can reduce ripple current through the supply’s output caps by 30–50%.
- Use polymer electrolytic or solid-state capacitors for high-ripple applications. Polymer caps have 5–10× lower ESR than standard electrolytics and handle ripple current 2–3× higher for the same case size.
Section 5: Connector and Mechanical Fatigue
The power supply’s input and output connectors are among the most mechanically stressed components—subjected to insertion cycles, cable strain, vibration, and thermal expansion mismatch. Yet they are often the least analyzed in reliability reviews.
5.1 DC Barrel Connector Wear and Intermittent Contact
Failure mechanism: DC barrel jacks and plugs experience mechanical wear on the center pin and sleeve contacts. Over repeated insertions (200–1,000 cycles for standard connectors, 5,000+ for high-durability types), the contact force diminishes, oxide layers build up on non-noble plating, and the connection resistance increases. Rising contact resistance generates localized heating, which accelerates oxidation—a thermal-runaway process.
Root causes:
- Connector plating not matched to the application environment (tin or tin-lead in humid environments)
- Connector rated for fewer cycles than the product lifetime requires
- Off-axis insertion or cable strain causing asymmetrical wear
- Low contact force from thin-wall barrel connectors
Engineering countermeasures:
- Specify gold-plated contacts for products that see frequent connector mating (≥ 500 insertion cycles expected)
- Use locking connectors (screw-lock, bayonet, or snap-lock types) for applications subject to vibration or accidental cable pulls
- Derate connector current rating by 50%: A connector rated for 5 A should carry no more than 2.5 A continuous in OEM designs. The margin accounts for contact resistance variation over lifetime.
- Add a PCB-mount retention feature (belly-to-board screw, through-hole strain relief, or adhesively bonded connector) to prevent solder joint fatigue from cable flex
5.2 Wire and Solder Joint Fatigue from Vibration
Failure mechanism: Continuous low-amplitude vibration (from fans, motors, or transportation) causes cyclic strain on solder joints and wire terminations. Over thousands to millions of cycles, cracks initiate at the solder fillet heel or wire entry point and propagate through the joint.
Root causes:
- Fan vibration in active-cooled equipment transmitted to the power supply board
- The product mounted on or near vibration sources (pumps, compressors, vehicle platforms)
- Heavy components (transformers, large capacitors, inductors) suspended from solder joints without adhesive or clip retention
- Rigid wire routing with no strain relief at the connector or solder termination
Engineering countermeasures:
- Secure heavy components with adhesive (silicone or epoxy) at the board underside, or use through-hole mounting with clinched leads for capacitors > 10 mm diameter
- Use conformal coating to distribute mechanical stress across component leads and improve fatigue life 3–5× in vibration environments
- Specify vibration testing per IEC 60068-2-6 (sinusoidal) or IEC 60068-2-64 (random) at the system level, not just the component level
- Add cable strain relief — a cable tie through a PCB anchor hole or a rubber grommet at the panel entrance prevents wire motion from reaching the solder termination
Section 6: Humidity, Condensation, and Contamination
Moisture is a surprisingly common cause of power supply failure—especially in equipment that cycles between on and off states, allowing condensation to form on cold surfaces.
6.1 Electrochemical Migration and Dendrite Growth
Failure mechanism: When moisture combines with ionic contaminants (flux residues, salt, airborne pollutants) and a DC bias, metal ions can migrate across the PCB surface between conductive traces. Over time, this forms conductive dendrites—metal filaments that grow from anode to cathode, eventually creating a short circuit.
Root causes:
- No conformal coating on the PCB in humid environments (> 80% RH)
- Flux residues from hand-soldered or poorly cleaned assemblies
- High voltage gradient between adjacent traces ( > 50 V/mm)
- Operating in condensing environments (refrigeration, outdoor enclosures, washdown areas)
Engineering countermeasures:
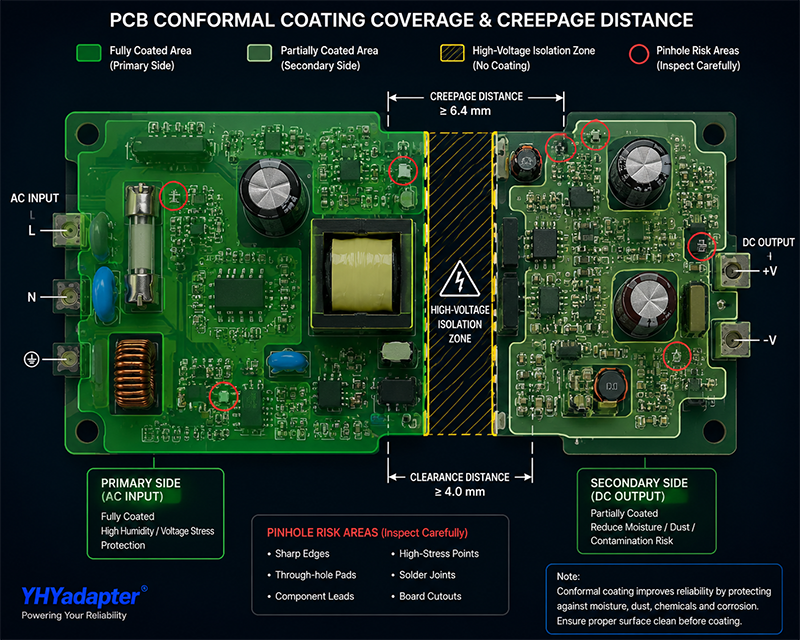
- Require conformal coating (acrylic or silicone type, 50–100 µm thickness) for any power supply operating in > 60% RH environments
- Increase trace spacing on primary-side high-voltage nodes to ≥ 2 mm between line and neutral (at the PCB level) and ≥ 6 mm between primary and secondary
- Use IP-rated enclosures for outdoor or washdown applications (minimum IP54 for outdoor, IP65 for washdown)—but note that sealed enclosures create their own condensation problems
- Specify “conformal coating inspection” as a quality checkpoint during the vendor’s production process
6.2 Power-On Condensation Failure
Failure mechanism: A supply that has been off and cold in a humid environment (e.g., overnight cooldown in a coastal facility) can accumulate condensation on internal surfaces. When power is applied, the condensation creates leakage paths across the PCB, potentially triggering input fuse blowing, arc tracking, or control circuit malfunction.
Root causes:
- Large thermal mass inside the supply that cools below dew point during off cycles
- Vented enclosure design that draws humid air into the housing during cool-down
- Rapid application of full mains voltage before condensation has evaporated
- No pre-heat or soft-start sequence in the control circuitry
Engineering countermeasures:
- Use conformal coating (this is the single most effective countermeasure)
- Select sealed or potted power supplies for extreme condensation environments—potting compound eliminates all air gaps and moisture pathways
- Implement a controlled power-on sequence in the equipment: apply input power for 5–10 seconds at no load to warm the supply before engaging the load
- Specify thermal cycling testing per IEC 60068-2-14 to validate the design against condensation stress
🛠️ Engineering Tip: If your product ships globally, consider that “tropical” conditions (40 °C / 95% RH per IEC 60068-2-78) are the real-world operating environment for many markets—Southeast Asia, parts of China, Central America. A supply designed for office conditions will fail prematurely in these regions without conformal coating or potting.
Section 7: Design-for-Reliability Checklist
Use the following checklist to evaluate power supply designs during vendor selection and design review. Risk Priority is scored 1 (low) to 5 (critical) — this helps you allocate reliability engineering effort proportionally.
| # | Check | Detail | Pass Criteria | Risk Priority |
|---|---|---|---|---|
| 1 | Capacitor derating | Operating temp vs. rated temp | ≤ 75 °C cap ambient for 105 °C rated caps | 5 |
| 2 | Capacitor life calculation | Vendor-provided lifetime projection | ≥ 50,000 hours at your operating point | 5 |
| 3 | Bulk cap voltage margin | Input cap rating vs. peak rectified voltage | ≥ 50 V margin (e.g., 450 V cap for 264 VAC input) | 4 |
| 4 | Thermal margin | Max continuous load vs. rated power | ≤ 80% of rated power at maximum ambient | 5 |
| 5 | Connector derating | Current vs. connector rating | ≤ 50% of rated current | 3 |
| 6 | Surge protection level | MOV energy rating | ≥ 150 J for industrial; ≥ 100 J for commercial | 4 |
| 7 | Humidity protection | Conformal coating / potting | Conformal coating for > 60% RH; potting for > 95% RH | 4 |
| 8 | Vibration resistance | Heavy component retention | Adhesive-secured or through-hole for > 10 mm diameter parts | 2 |
| 9 | Short-circuit protection | Hiccup vs. latch-off | Latch-off or long-retry for persistent fault environments | 3 |
| 10 | Burn-in test duration | Production burn-in time | ≥ 2 hours at 40 °C / full load | 4 |
Risk Priority Legend:
- 5 (Critical): Failure leads to immediate product failure, safety hazard, or accounts for 40%+ of field returns
- 4 (High): Failure causes significant performance degradation or 15–40% of field returns
- 3 (Medium): Failure reduces lifetime but allows continued operation; 5–15% of field returns
- 2 (Low): Failure affects non-critical functions or < 5% of field returns
- 1 (Minimal): Degradation only under extreme, rarely encountered conditions
Root Cause Troubleshooting Flowchart
When a power supply fails in the field, use this decision tree to isolate the failure mode and identify the correct countermeasure:
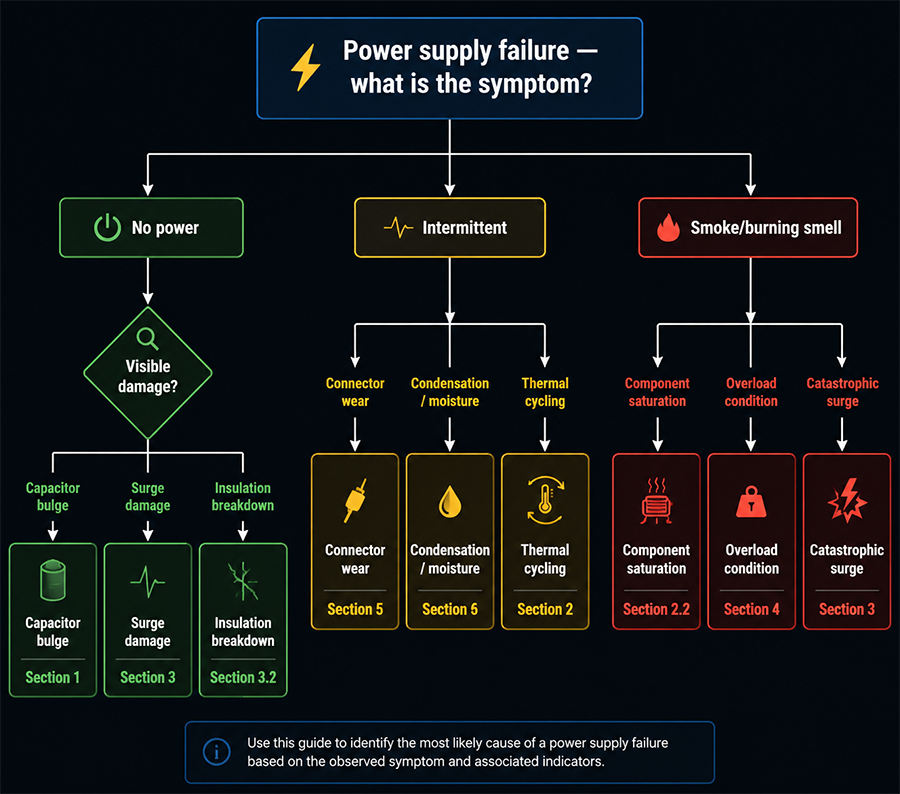
How to use this flowchart:
- Observe the primary symptom — What does the equipment do? Is there visible damage, abnormal behavior, or environmental context?
- Follow the decision branches — Each yes/no question narrows the possible failure mechanisms
- Identify the root cause — The endpoint maps to one of the seven failure modes covered in this guide
- Apply the countermeasure — Reference the numbered section for detailed engineering solutions
Quick Symptom → Section Reference:
| Primary Symptom | Likely Failure Mode(s) | Section |
|---|---|---|
| Bulging capacitor, brown residue | Electrolytic capacitor drying | 1.1 |
| Works when cool, fails when hot | Capacitor drying or semiconductor overstress | 1.1, 2.1 |
| Output ripple increasing over months | Capacitor ESR rise | 1.1 |
| Blown fuse, no visible damage | Input surge or insulation breakdown | 3.1, 3.2 |
| Intermittent resets, no visible damage | Connector wear, vibration fatigue, or condensation | 5.1, 5.2, 6.2 |
| Smoke from enclosure | Catastrophic component failure (surge, saturation) | 3.1, 2.2 |
| Failure in high-humidity markets only | Electrochemical migration or condensation | 6.1, 6.2 |
| Failure at specific locations (coastal) | Humidity + contamination | 6.1 |
| Fails during power-on after off cycle | Power-on condensation | 6.2 |
| Short circuit fault persists, hiccup cycling | Hiccup-mode fatigue | 4.1 |
| Connector hot to touch | DC connector wear / high contact resistance | 5.1 |
| Vibration environment + failure | Solder joint fatigue or loose component | 5.2 |
Related Resources
🔌 Related Products
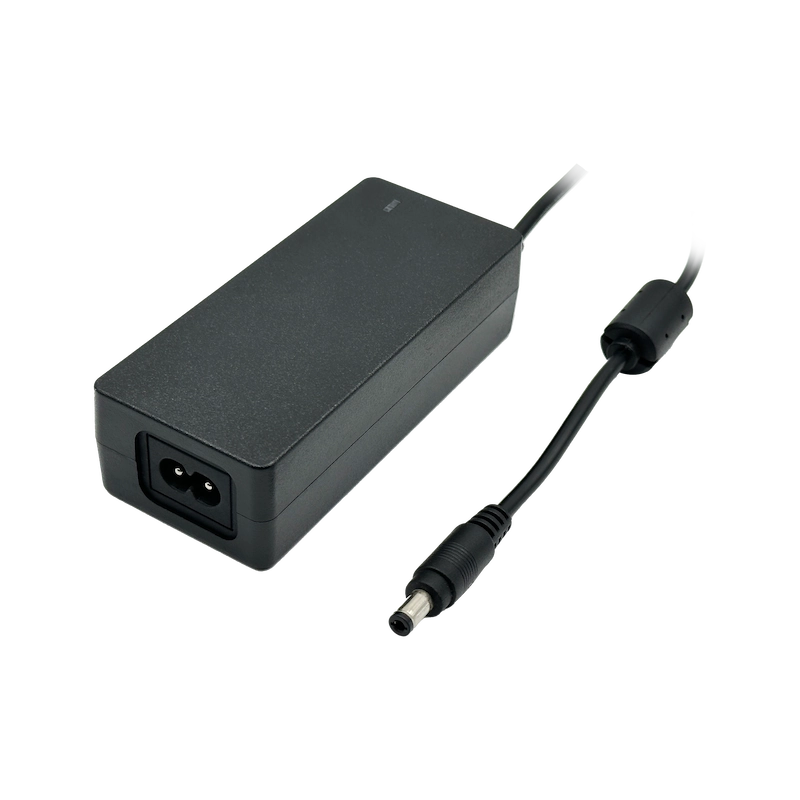
Desktop Power Adapters
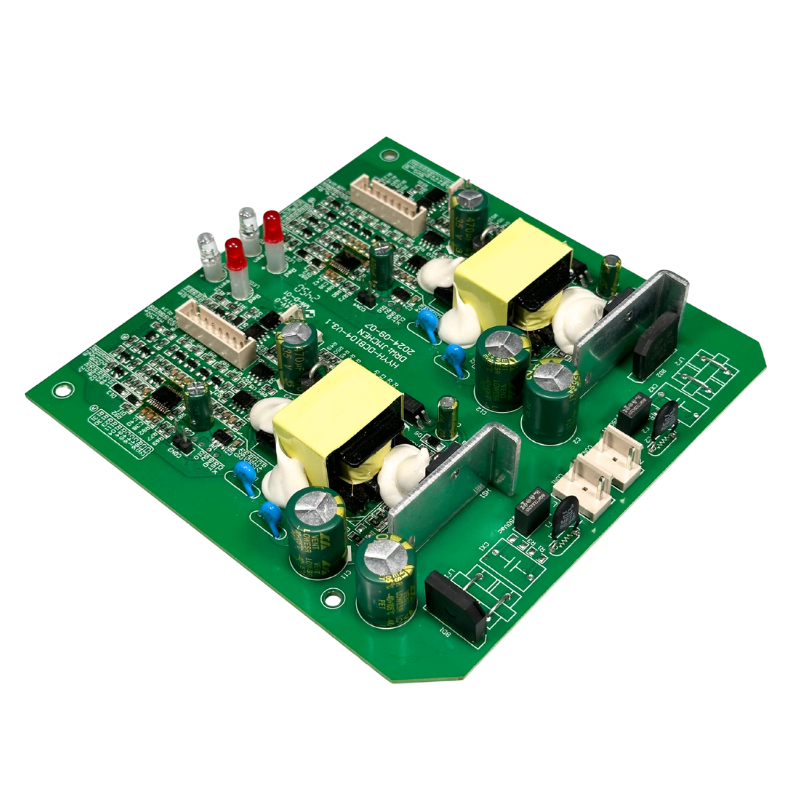
Open Frame Power Supplies
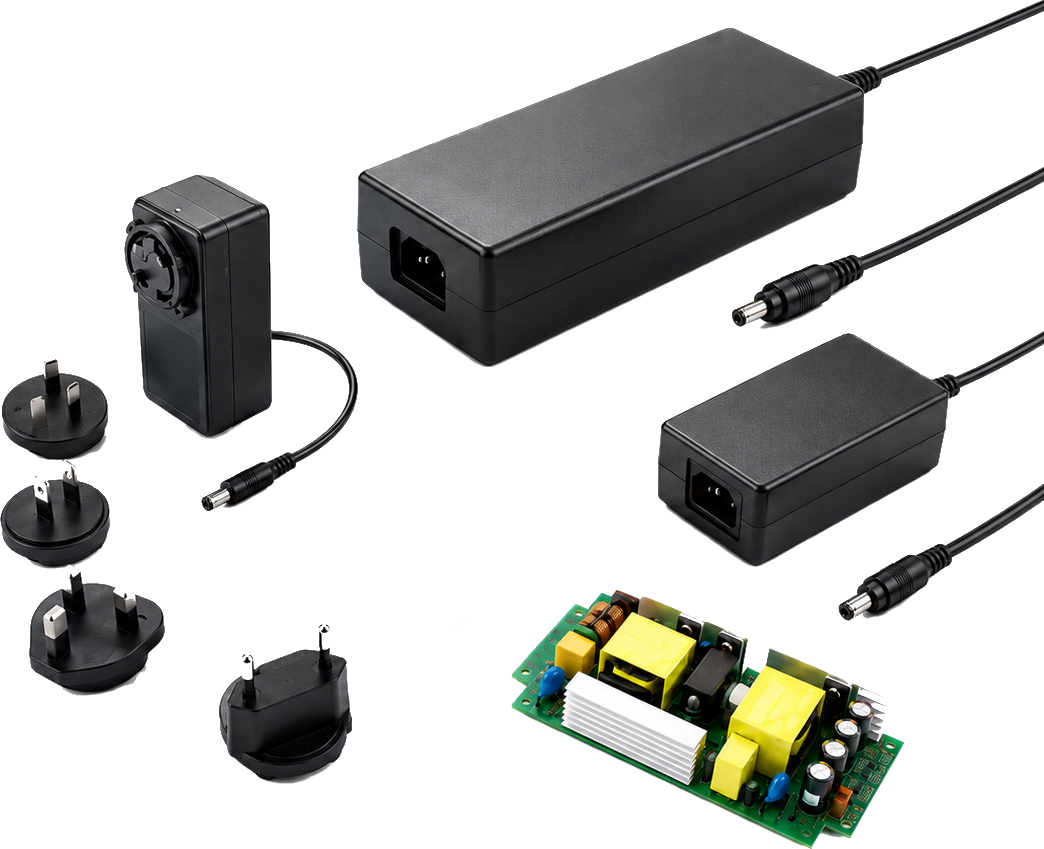
OEM Custom Solutions
🏭 Related Applications

Industrial Control Power Solutions
How to match power supply specs to 24/7 industrial automation loads — derating, protection, and efficiency considerations for factory environments.
Medical Device Power Adapters
Specifying power for patient-near and diagnostic equipment: leakage current limits, 2×MOPP isolation, and medical-grade certification requirements.
📖 Related Guides
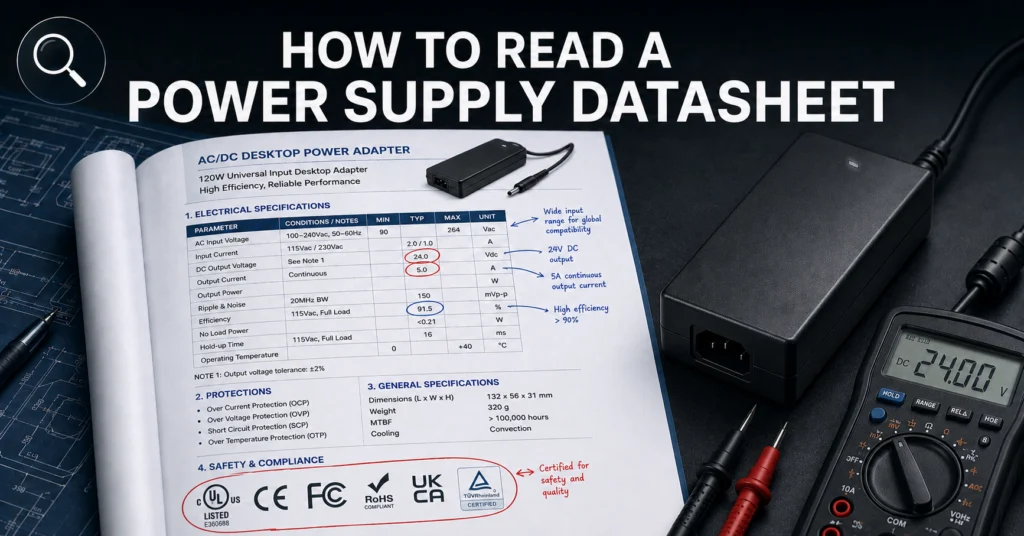
How to Read a Power Supply Datasheet: OEM Procurement Guide

The Complete OEM Guide to DC Power Connector Types
Frequently Asked Questions
1. What is the expected lifetime of a quality AC/DC power supply in continuous operation?
Quality AC/DC power supplies with electrolytic capacitors are typically rated for 30,000–70,000 hours continuous operation at their maximum rated temperature and full load. At 40 °C ambient with 70% loading, a high-quality 100 W supply should exceed 100,000 hours (11+ years) of useful life. The key driver is the capacitor temperature — every 10 °C reduction doubles expected capacitor life.
2. How do I distinguish a random component failure from a systematic design issue?
Three indicators suggest a systematic issue: (1) failures cluster in a specific operating condition (high ambient, specific load level, or particular input voltage); (2) the failure mode is consistent across multiple units (e.g., always the same MOSFET or capacitor location); (3) the failure rate shows wear-out (increasing with operating time) rather than a constant hazard rate. Maintain a failure-mode log documenting conditions for every field return.
3. Does conformal coating always solve moisture-related failures?
Conformal coating dramatically reduces moisture-related failures but is not a universal cure. Pinholes, poorly coated component leads, and coating delamination at sharp edges can leave vulnerabilities. For extreme environments (> 95% RH, condensing, or washdown), potting (full encapsulation) is more reliable than conformal coating. Two-component silicone or polyurethane potting eliminates all air gaps.
4. Can a power supply be too conservatively derated?
Excessive derating can introduce reliability issues of its own. Operating a 300 W supply to power a 30 W load (90% derating) keeps temperatures low, but the large output capacitance increases inrush current, the supply may operate at very low duty cycles that stress the PWM controller, and the oversizing adds cost and physical volume. A practical sweet spot for most designs is 20–30% power derating and 10–20 °C temperature derating.
5. What burn-in duration is recommended for production-validation testing?
For standard commercial products, 4 hours of burn-in at 40 °C ambient and full rated load catches approximately 80% of infant-mortality failures. For mission-critical applications (medical, industrial controls, outdoor infrastructure), 24–48 hours of burn-in with temperature cycling (40 °C to 60 °C ambient over 4-hour cycles) provides significantly better field reliability. YHYadapter offers extended burn-in as a standard option on all custom OEM designs.
6. How do I select MOVs for surge protection in different application environments?
The MOV energy rating should match the expected surge environment: Level 1/2 (office/commercial): 100–150 J; Level 3 (industrial/light outdoor): 200–300 J; Level 4 (heavy outdoor/high-exposure): 300–500 J using 20–32 mm diameter MOVs. Also consider MOV lifetime — MOVs degrade with every surge event, so specifying a larger diameter (32 mm vs 14 mm) provides 5–10× the energy absorption cycles before end-of-life.
Key Takeaways
- Capacitors are the weakest link. 40–60% of field failures trace to electrolytic capacitors. Derate operating temperature aggressively and request lifetime calculations from vendors.
- Heat accelerates everything. Every 10 °C temperature reduction doubles electrolytic capacitor life and significantly extends semiconductor reliability. Design for thermal margin, not thermal adequacy.
- Surge protection is application-specific. Commercial-grade protection (100 J MOV, Level 2 immunity) is insufficient for industrial or outdoor applications. Specify protection level to the deployment environment, not the cheapest standard.
- Moisture is a silent killer. Conformal coating or potting is essential for any supply operating above 60% RH, regardless of whether the application “feels” humid. Condensation from thermal cycling is a design reality, not an edge case.
- Connectors fail from the inside out. Derate connector current by 50%, match plating to environment, and add mechanical strain relief. Connector failure is slow, progressive, and often misattributed to the power supply itself.
- Burn-in catches infant mortality. A minimum 4-hour burn-in at elevated temperature is the most cost-effective reliability screening step available. For critical applications, extend to 24+ hours with thermal cycling.
- Systematic logging beats guesswork. Every field return should produce a documented failure mode. Over time, this log becomes the most valuable reliability engineering asset your team has.
Conclusion: Building Reliability into Your Power Architecture
Power supply reliability is not a property that can be tested in at the end of the development cycle. It is the cumulative result of dozens of design decisions—capacitor voltage margin, connector plating, creepage distance, thermal simulation accuracy, protection circuit topology, and environmental protection specification.
Each of the seven failure modes described in this guide is avoidable with deliberate engineering choices made during the specification and design review phase. The cost of adding a 450 V capacitor instead of a 400 V type, or specifying conformal coating on a board that will ship to Southeast Asia, is trivial compared to the cost of field failures, warranty returns, and damaged reputation.
At YHYadapter, we incorporate these design-for-reliability principles into every OEM power supply we build. Our engineering team provides lifetime calculations, thermal simulations, and application-specific protection customization as part of the standard OEM engagement process.
Ready to build reliability into your next power supply design? Our OEM engineering team can review your application requirements and provide failure-mitigation strategies specific to your operating environment and load profile.
📥 Download: Reliability Engineering Toolkit
- Power Supply Reliability Design Checklist (PDF) — Print-ready version of the Section 7 checklist including columns for your in-house review sign-off
- Failure Analysis Worksheet (PDF) — Track field returns, record failure modes, identify root causes, and prioritize corrective actions across your product lines`