
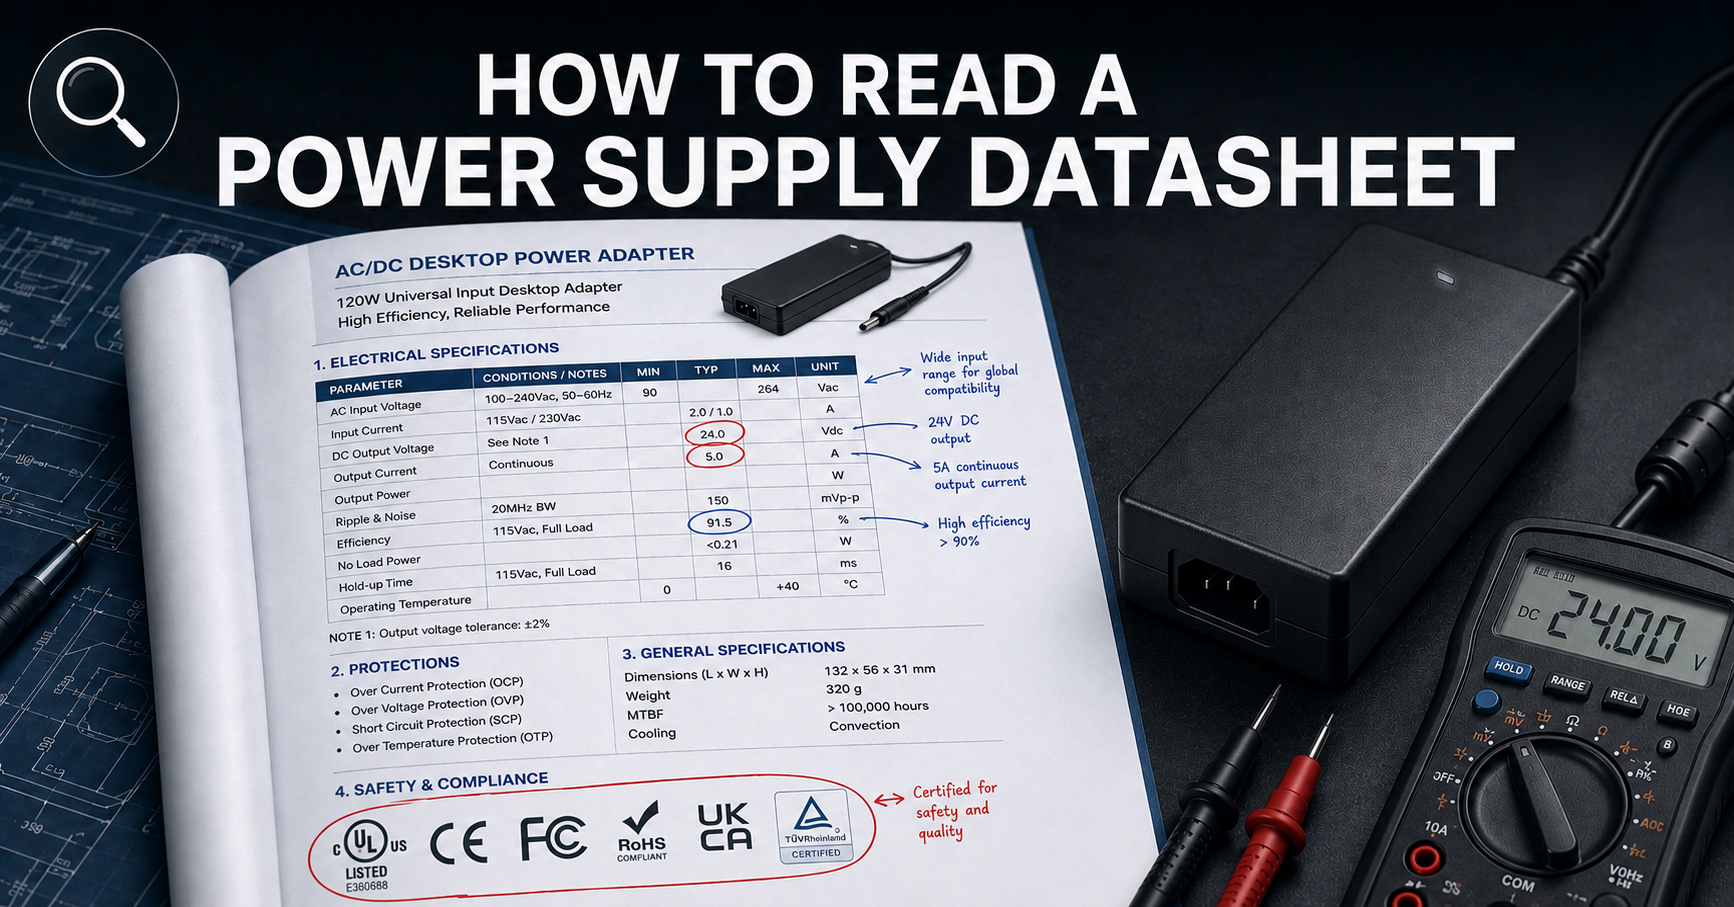
A power supply datasheet is the single most important document in the OEM procurement process. It is the vendor’s promise—in writing—of how the product will perform under specified conditions. Yet many OEM procurement teams skim datasheets rather than read them critically, leading to costly mismatches between the spec sheet and actual application requirements.
The challenge is that datasheets are not standardized across manufacturers. One vendor’s “12 V / 5 A” may derate to 3.5 A at 50 °C ambient, while another’s may deliver full rated current up to 60 °C. The difference is buried in fine print, footnotes, and test conditions.
This guide provides a structured framework for reading, interpreting, and comparing power supply datasheets. It covers input/output parameters, protection features, environmental ratings, efficiency declarations, and certification marks—with specific callouts for the traps OEM procurement teams encounter most frequently.
🛠️ Engineering Tip: Print the datasheet and annotate it by hand during your first read-through. Marking key numbers and circling footnotes physically forces you to slow down and catch details you would otherwise skim past.
Why Power Supply Datasheet Literacy Matters in OEM Procurement
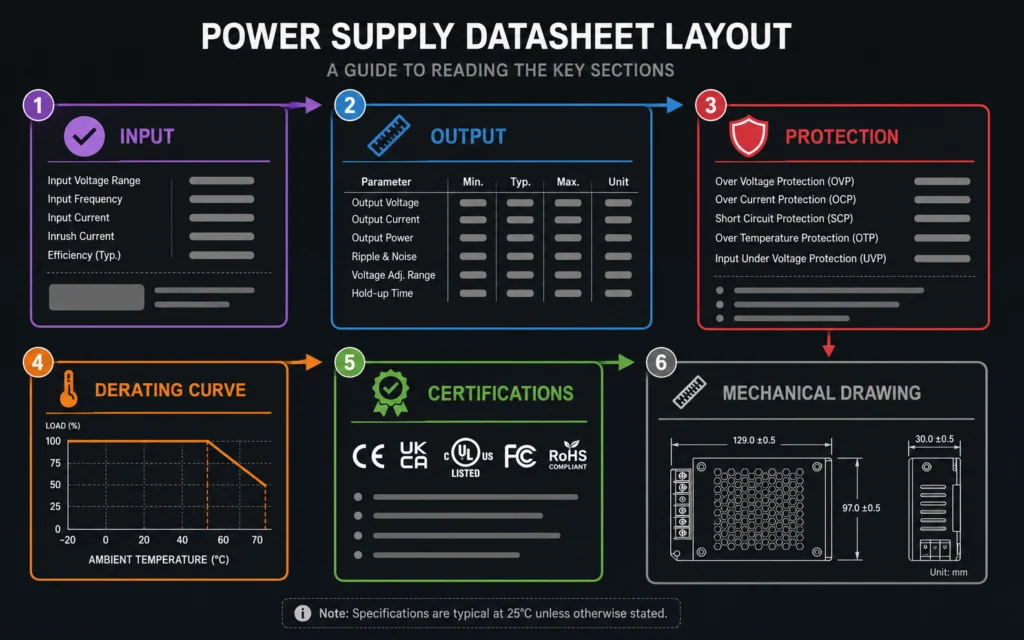
Before diving into specific parameters, it helps to understand why careful datasheet reading directly impacts your project cost and timeline:
- Spec mismatch drives redesigns. A datasheet that lists “0–50 °C operating range” but derates output current above 40 °C may force an enclosure redesign or a larger, costlier power supply.
- Hidden costs in compliance. A datasheet claiming “UL certified” without specifying the UL standard number can delay market entry when your compliance team discovers it is UL 60950-1 (obsolete for new products) rather than UL 62368-1.
- Cross-vendor comparison requires normalization. One vendor may specify ripple & noise at 25 °C with a 20 MHz bandwidth limit; another may use 100 MHz bandwidth at 50 °C. The apparent difference may be measurement method, not actual performance.
A disciplined reading protocol eliminates these surprises before prototype stage.
🛠️ Engineering Tip: Bookmark the YHYadapter datasheet library and cross-reference any external datasheet against our published specs for equivalent power levels. Our team publishes detailed parameter tables for every product line.
Section 1: Input Specifications — What Goes In
🛠️ Engineering Tip: When reviewing input voltage range, check both the nominal AND the minimum operating voltage at full load. Some adapters that claim 90–264 VAC operation only deliver full power at 100 VAC and above—the datasheet fine print is where this distinction lives.
Input Voltage Range
Most external power supplies specify a universal input range of 100–240 VAC, 50/60 Hz. However, the datasheet may list nominal vs. operating ranges:
| Term | Meaning | Typical Value |
|---|---|---|
| Nominal voltage | Standard mains voltage the adapter is designed for | 100–240 VAC |
| Operating voltage range | Extended range where the adapter may still function but at reduced performance | 90–264 VAC |
| Brownout / hold-up threshold | Minimum voltage before output drops out | 70–85 VAC |
What to watch for: Some cost-optimized adapters split their input ranges (e.g., 100–120 VAC and 200–240 VAC with a manual switch). These are incompatible with global OEM products. Always specify auto-ranging universal input unless your application is single-market.
Input Current and Inrush
The input current value (e.g., “1.5 A max at 100 VAC”) represents the worst-case RMS current drawn under full load and minimum input voltage. This matters for:
- Circuit breaker and fuse selection in the end equipment
- Wiring gauge for the power cord or panel-mount connector
- Transformer and PFC stage sizing
Inrush current is the momentary surge when the adapter is first plugged in. Datasheets typically list both the peak value (e.g., “60 A peak”) and the duration (e.g., “< 5 ms”). High inrush can trip facility breakers or damage relay contacts in multiplexed power systems. If your application includes hot-plugging or power distribution panels, compare inrush specifications carefully.
Power Factor
For adapters above 75 W shipped to the EU, Japan, or China, power factor correction (PFC) is often mandatory. The datasheet should state:
- With PFC: PF ≥ 0.90 at full load (active PFC) or PF ≥ 0.70 (passive PFC)
- Without PFC: PF 0.50–0.65, which doubles the apparent current draw
A 150 W adapter without PFC draws approximately 2.5 A at 100 VAC. With active PFC, the same adapter draws approximately 1.7 A. If you are powering 100 units from a single distribution panel, the difference is 80 A of bussing capacity.
Section 2: Output Specifications — The Performance Contract
Output Voltage and Tolerance
The nominal output voltage (e.g., 12 VDC) is always accompanied by a tolerance band:
- Standard tolerance: ±5% (11.4–12.6 VDC for a 12 V rail)
- Tight tolerance: ±3% (11.64–12.36 VDC) — often specified for precision analog or RF loads
- Adjustable output: Some datasheets indicate an external trim resistor or pot to dial in voltage
Critical fine-print check: The tolerance band is usually specified at full load, nominal input, 25 °C. At minimum input voltage + elevated temperature + 10% load, the voltage may drift to the edge of the band. Design your load to tolerate the worst-case combination, not just the nominal spec.
Output Current and Derating
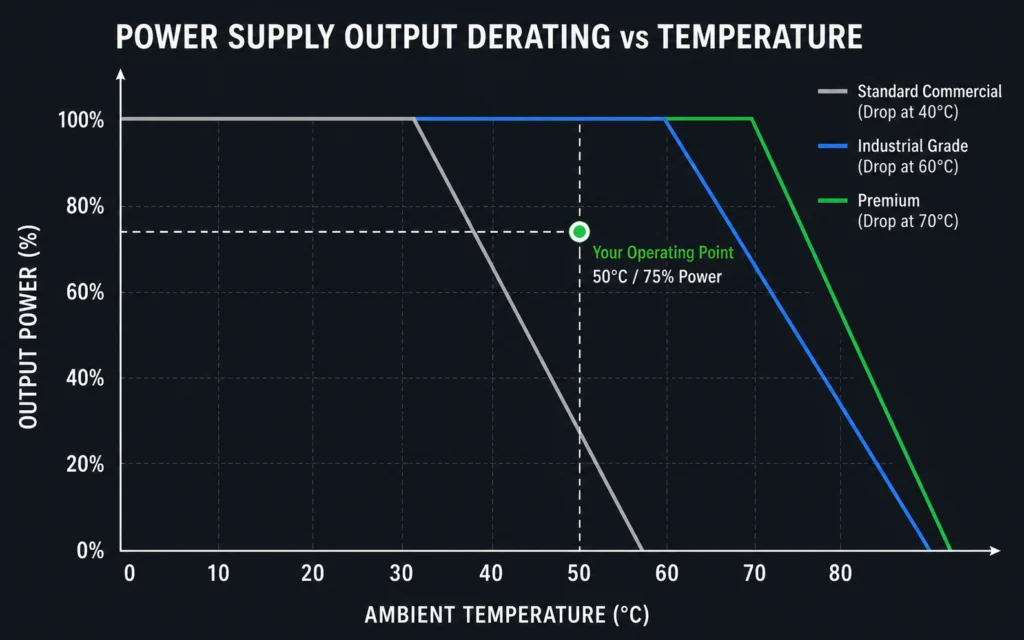
The rated output current (e.g., “5 A continuous”) is almost always derated under real-world conditions:
| Condition | Derating Factor | Effective Current at 12 V |
|---|---|---|
| 25 °C (datasheet nominal) | 1.00× | 5.0 A (60 W) |
| 40 °C | 0.90× | 4.5 A (54 W) |
| 50 °C | 0.75× | 3.75 A (45 W) |
| 60 °C | 0.50× | 2.5 A (30 W) |
| Low input (90 VAC) + 50 °C | 0.40× | 2.0 A (24 W) |
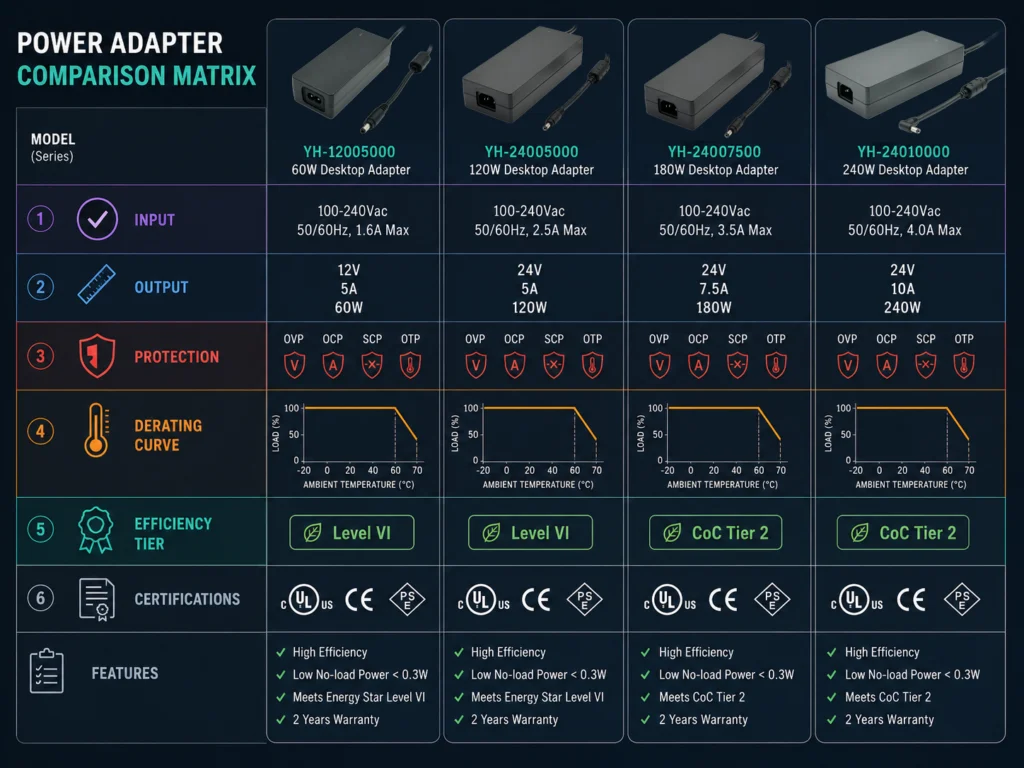
The derating curve is one of the most critical (and most overlooked) sections of any datasheet. Always plot your application’s operating point (ambient temperature + input voltage + load) on the vendor’s derating curve before approving samples.
Ripple and Noise
Ripple & noise (R&N) is specified as peak-to-peak voltage measured at the output terminals:
- Typical value: 1–2% of output voltage (e.g., 120–240 mV p-p for 12 V)
- Low-noise designs: 50–100 mV p-p — used for audio, medical, or measurement equipment
- Measurement conditions matter: The datasheet should state bandwidth (20 MHz or 100 MHz), termination method (20 µF tantalum + 0.1 µF ceramic), and temperature
The trap: Two datasheets may specify R&N at different bandwidths. A 150 mV p-p spec measured with 20 MHz bandwidth is not directly comparable to 150 mV p-p measured with 100 MHz bandwidth. Always normalize measurement conditions before comparing.
Load Regulation and Line Regulation
| Parameter | What It Measures | Typical Spec | Why It Matters |
|---|---|---|---|
| Load regulation | Voltage change from 10% load to 100% load | ±1% or ±2% | Load transients in digital systems |
| Line regulation | Voltage change from low line to high line | ±0.5% or ±1% | Voltage stability in regions with weak mains |
Load regulation is generally more important for most OEM applications. A medical device that idles at 20% load and spikes to 80% during treatment needs tight load regulation to avoid reset or calibration errors.
Section 3: Protection and Safety Parameters
Datasheets should explicitly state the protection features present and their trigger thresholds:
| Protection | What It Does | Typical Threshold | Auto-Recovery? |
|---|---|---|---|
| OVP (Over-Voltage Protection) | Clamps or shuts down output if voltage exceeds safe limit | 110–130% of nominal Vout | Usually — latch or hiccup |
| OCP (Over-Current Protection) | Limits output current during overload | 110–150% of rated Iout | Yes — hiccup mode |
| SCP (Short-Circuit Protection) | Protects output from direct short | Instantaneous shutdown | Yes — auto-recovery |
| OTP (Over-Temperature Protection) | Shuts down if internal temperature exceeds limit | 90–110 °C (internal sense) | Yes — auto-recovery after cool-down |
Caveat: Some vendors list “SCP” but mean “short-circuit protection after 1 second” — during which the output may reach damaging current levels. If your application includes capacitive loads or back-connector hot-plugging, verify the protection response time in the datasheet or request a test report.
Section 4: Environmental and Mechanical Ratings
Operating Temperature Range
Most commercial adapters specify 0–40 °C or 0–50 °C operating range at full load. Industrial-rated adapters extend to -20 °C to +70 °C with appropriate derating.
Key checkpoints:
- Is the range at full load or derated?
- Is cold-start at -20 °C supported, or does the adapter require a warm-up period?
- What is the storage temperature range? (Often wider: -40 °C to +85 °C)
IP Rating and Environmental Sealing
| Rating | Protected Against | Typical Use |
|---|---|---|
| IP20 | Solid objects > 12 mm, no water protection | Indoor desktop, controlled environment |
| IP22 | IP20 + dripping water when tilted 15° | General indoor |
| IP54 | Limited dust ingress + splashing water | Industrial floor, workshop |
| IP65 | Dust-tight + water jets | Outdoor, washdown areas |
For outdoor or harsh-environment OEM products, pay close attention to the dust ingress and water ingress classification separately—a rating like “IP65” is not a single check but a combination of dust (6) and water (5).
Mechanical Dimensions and Mounting
Datasheets should provide:
- 3-view dimension drawing (length × width × height)
- Mounting hole pattern (for open-frame and desktop units)
- Input connector type — IEC C14/C8, fixed plug, terminal block
- Output connector type — barrel jack (5.5×2.5 mm, 5.5×2.1 mm, etc.), terminal block, custom
- Weight — relevant for shipping cost and vibration testing
Where possible, request a mechanical outline drawing (DXF or PDF) rather than relying on the datasheet diagram alone. PCB-mounted and enclosure-integrated designs need ±0.5 mm accuracy.
Section 5: Efficiency and Standby Compliance
Efficiency data is usually presented as a table or curve:
| Load % | Efficiency (115 VAC) | Efficiency (230 VAC) |
|---|---|---|
| 25% | 84.5% | 86.2% |
| 50% | 87.1% | 89.0% |
| 75% | 87.8% | 89.5% |
| 100% | 87.0% | 88.8% |
| Average | 86.6% | 88.4% |
The average efficiency (arithmetic mean across 25%, 50%, 75%, and 100% load) is the metric used for DoE Level VI and ErP compliance. Standby (no-load) power consumption is listed separately, typically in milliwatts.
What to look for:
- Efficiency at the load point your product actually operates at — if your device draws 30% of the adapter’s rated power, that 25%-load efficiency number matters more than the average.
- Dual-voltage compliance — some adapters meet Level VI at 230 VAC but barely pass at 115 VAC. For global products, verify both columns.
- CoC Tier 2 qualification — if your customer or end-market demands premium efficiency, check for a separate datasheet line confirming Tier 2 compliance.
Section 6: Certification Marks — What They Actually Mean
A datasheet dense with certification logos (UL, CE, FCC, PSE, CCC, KC, RCM, BIS) can look authoritative, but the marks require validation:
| Mark | Standard | What to Verify |
|---|---|---|
| UL | UL 62368-1 (latest) or UL 60601-1 (medical) | Certificate number and scope — is it the safety standard your product needs? |
| CE | LVD 2014/35/EU + EMC 2014/30/EU | Declaration of Conformity must list the harmonized standards. |
| FCC Part 15 | Class B (residential) or Class A (industrial) | Class A may not be sufficient for end-user equipment sold into homes or offices. |
| PSE | DENAN Ordinance (Japan) | Not a voluntary mark — mandatory by Japanese law. Verify the diamond (specific category) vs. circle (non-specific) mark. |
| CCC | GB 4943.1 / GB 17625.1 (China) | Mandatory for products sold in China. Verify the certificate covers your output parameters. |
| KC | KC 62368-1 (Korea) | Required for Korean market. KC mark must be accompanied by the certificate number. |
| RCM | AS/NZS 4417.1 (Australia/New Zealand) | Requires both safety and EMC compliance. Verify supplier is registered in the national database. |
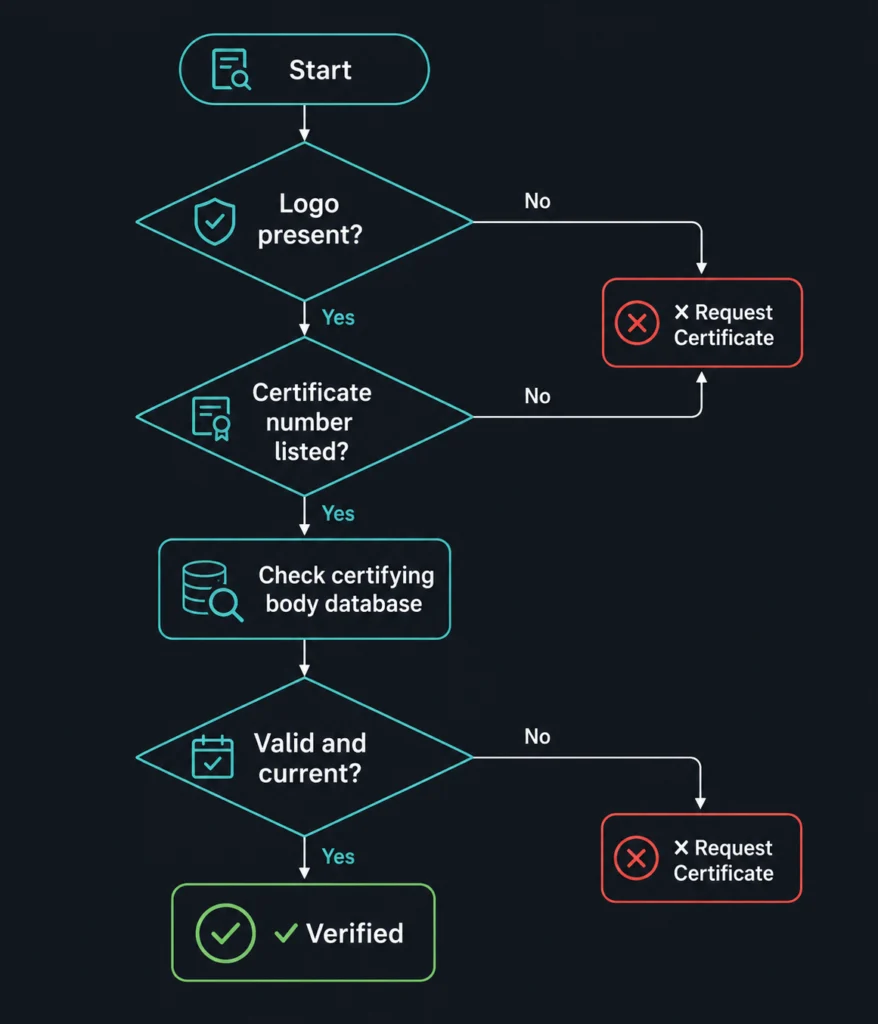
Critical rule: Never rely on the datasheet logos alone. Request a certificate copy with the vendor’s legal name, the tested model number, and the applicable standard edition. A UL mark from 2018 referencing UL 60950-1 is invalid for new product registrations under the 2020+ UL 62368-1 framework. For reference, you can browse our UL 62368-1 certification, IEC 60601-1 medical certification, and CE/FCC EMC compliance pages to see what proper certification documentation looks like.
📞 CTA Block — Need Help Specifying a Power Supply for Your OEM Project?
Our engineering team reviews datasheets daily and can help you verify specifications, compare vendors, and select the right adapter for your application.
- Request a Quote → — Submit your requirements for a detailed quotation
- Talk to an Engineer → — Discuss technical specs with our design team
Datasheet Review Checklist
Use this checklist before approving any power supply for your OEM product. Print it and keep it with every datasheet you evaluate.
Input & Output
- Input voltage range covers all target markets (100–240 VAC auto-ranging)
- Output voltage tolerance at worst-case (min input + max temp + light load)
- Rated current sufficient after derating at your maximum ambient temperature
- Ripple & noise within your load’s tolerance (verify measurement bandwidth)
- Load regulation at transient conditions (10% ↔ 100% load step)
Protection & Safety
- OVP threshold below your load’s absolute maximum rating
- OCP/SCP present with auto-recovery (hiccup mode preferred)
- OTP shutdown temperature compatible with your enclosure design
- Isolation voltage meets safety class requirements
- Leakage current within limits for medical/touchable applications
Environment & Compliance
- Operating temperature range covers your product’s rated ambient
- Derating curve verified at your operating point (input voltage × temperature × load)
- Mean Time Between Failures (MTBF) meets your product lifecycle target
- Hold-up time ≥ 16 ms (or your minimum requirement)
- IP rating sufficient for installation environment
Documentation
- Third-party certification reports requested (not just datasheet logos)
- Certificate numbers cross-referenced on certifying body database
- Mechanical outline drawing (DXF or PDF) within ±0.5 mm tolerance
- Datasheet revision date — is it the latest published version?
- Vendor confirmed lead time and MOQ for your target volume
📥 Download the Datasheet Comparison Checklist — We’ve prepared a ready-to-use Excel spreadsheet that includes this checklist plus a side-by-side vendor comparison template. Download Now → (Requires name and email — delivered instantly)
How to Compare Datasheets Across Vendors
When evaluating competing adapters, use this six-point comparison framework:
- Normalize test conditions. Derating curves, R&N bandwidth, efficiency measurement points — ensure all vendors use comparable methods before comparing numbers.
- Check worst-case, not typical. A datasheet listing “85% typical efficiency” may have minimum thresholds far lower. Demand worst-case or guaranteed minimum values.
- Verify certifications at the model level. A vendor’s generic “UL certified” marketing claim does not guarantee the specific model is listed. Request model-specific certificate copies.
- Compare derating curves — not just max ratings. The adapter that delivers 100% rated power at 50 °C may be more cost-effective than one with a higher headline rating that derates sharply at 40 °C.
- Request test reports for critical parameters. For medical, industrial, or safety-critical applications, a third-party test report for ripple, hold-up time, and protection thresholds is worth the investment.
- Build a datasheet comparison matrix. Standardize your evaluation by creating a fixed template of parameters to extract from each vendor’s datasheet. This eliminates the bias of different datasheet formats.
🛠️ Engineering Tip: Use the downloadable Datasheet Comparison Checklist as your standardized template. It pre-populates all 20+ parameters and includes a scoring column for vendor evaluation.
Related Resources
🔌 Related Products
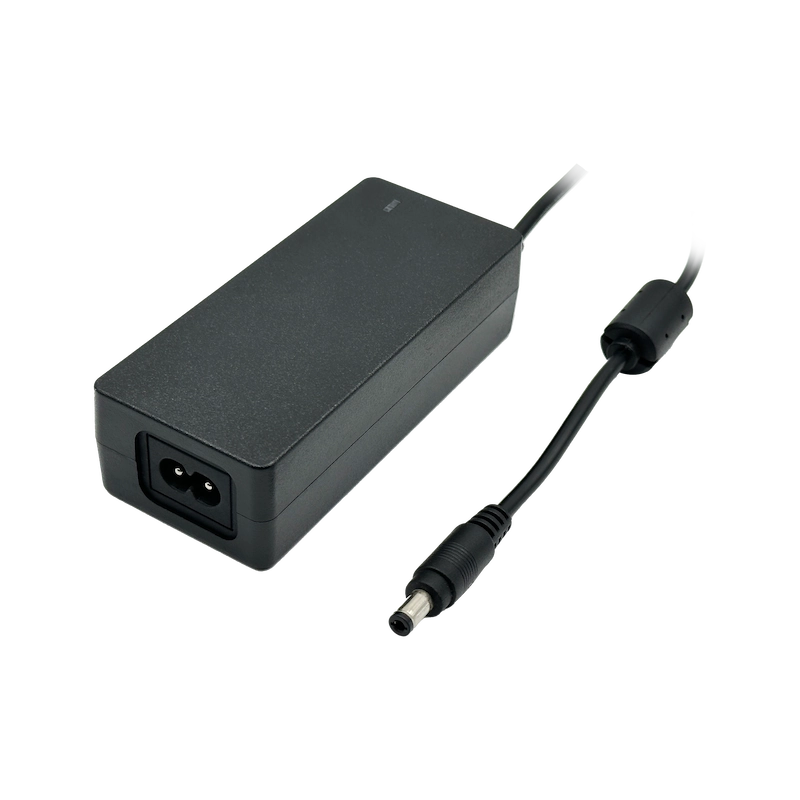
100–240 VAC input, 65 W output, DoE Level VI compliant. Active-clamp flyback topology. Input and output spec details available in full datasheet.
Medical-grade YHY-12005000 (12V 5A 60W) — IEC/EN 60601-1 certified on this model. Full protection set (OVP, OCP, SCP, OTP). Datasheet available on request.
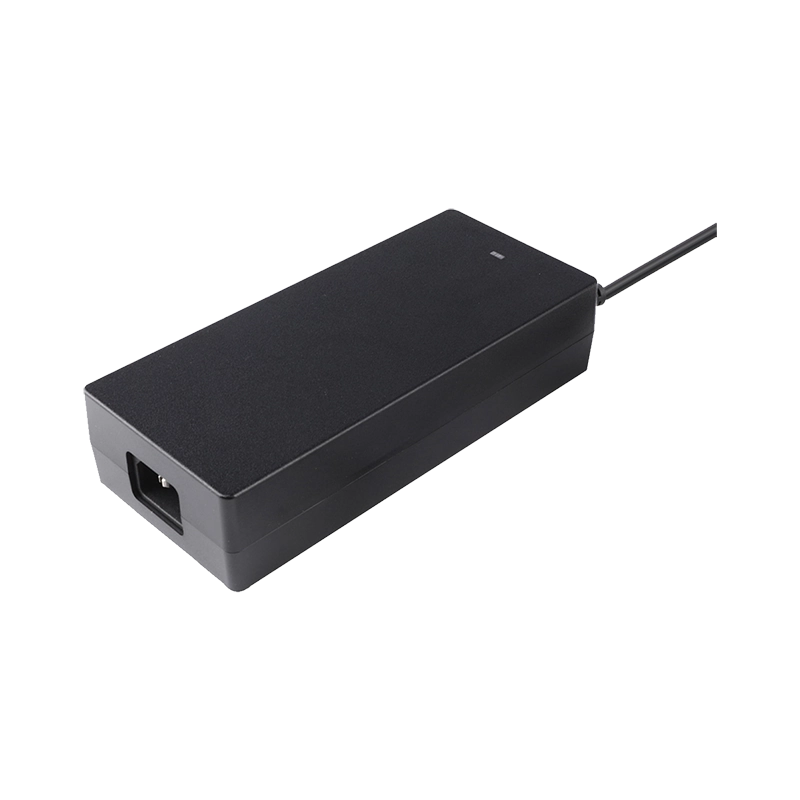
240 W peak-rated with active PFC. Suitable for higher-power automation and test equipment. Request full spec sheet.
🏭 Related Applications

Industrial Control Power Solutions
How to match power supply specs to 24/7 industrial automation loads — derating, protection, and efficiency considerations for factory environments.

Medical Device Power Adapters
Specifying power for patient-near and diagnostic equipment: leakage current limits, 2×MOPP isolation, and medical-grade certification requirements.

Beauty Equipment Power Supplies
Power adapter requirements for IPL, RF, and laser beauty devices — key datasheet parameters for pulsed-load applications.
📖 Related Guides
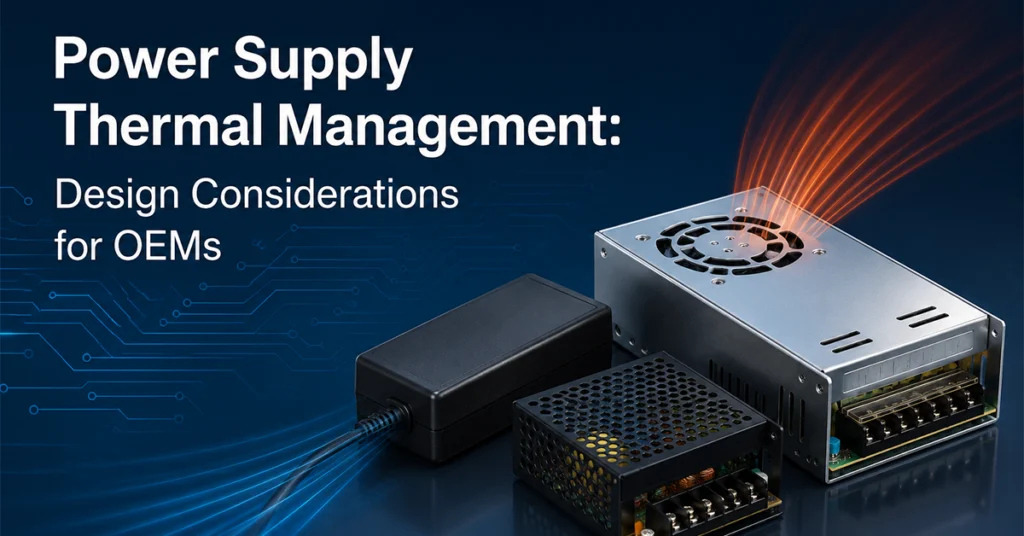
Wall Plug vs Desktop Power Adapter: Engineering Comparison
Understand the mechanical, thermal, and certification differences between wall-mounted and desktop form factors before selecting a platform.
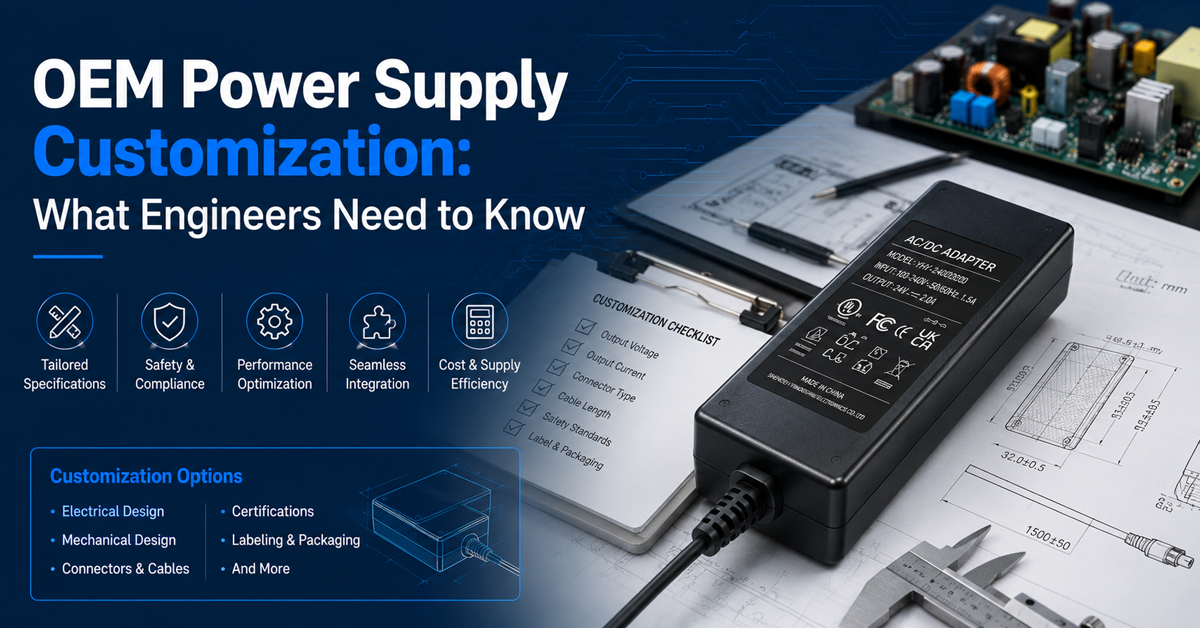
Power Supply Efficiency Ratings: What OEMs Need to Know
Comprehensive guide to DoE Level VI, ErP 2019/1782, and CoC Tier 2 efficiency standards. Companion reading for the efficiency section of any datasheet.
📚 Topic Cluster: Power Adapter Fundamentals
← Efficiency Ratings | Datasheet Reading | Failure Modes →
✅ Related Certifications
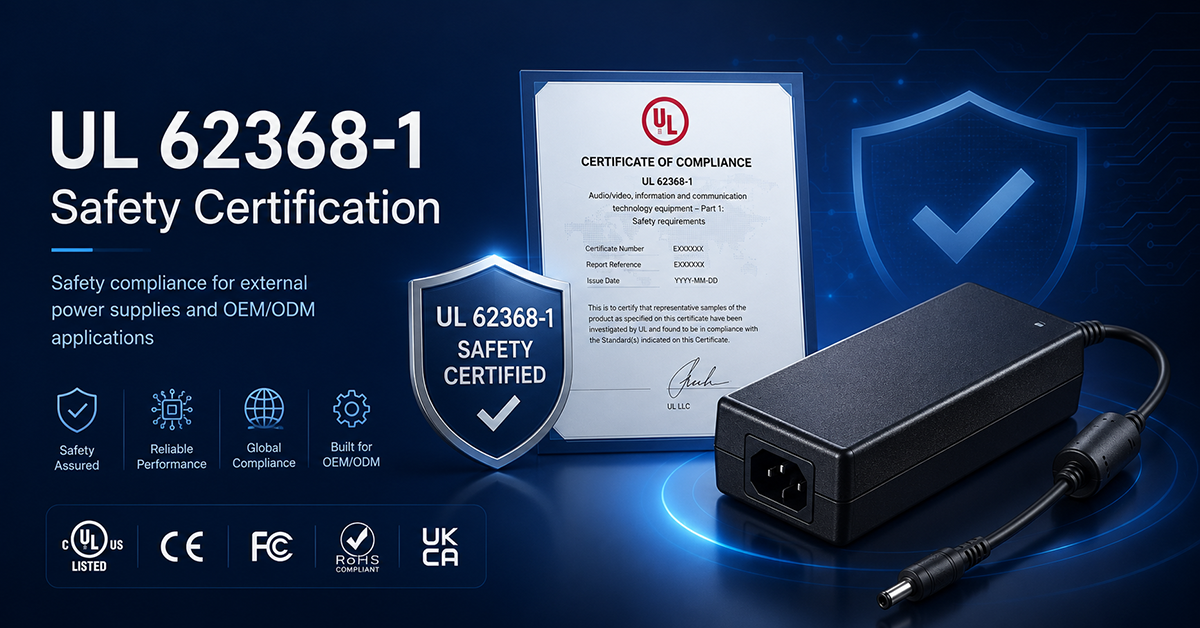
UL 62368-1 Safety Certification
Third-party safety certification for IT/AV equipment power adapters. Certificate number and scope verification reference.
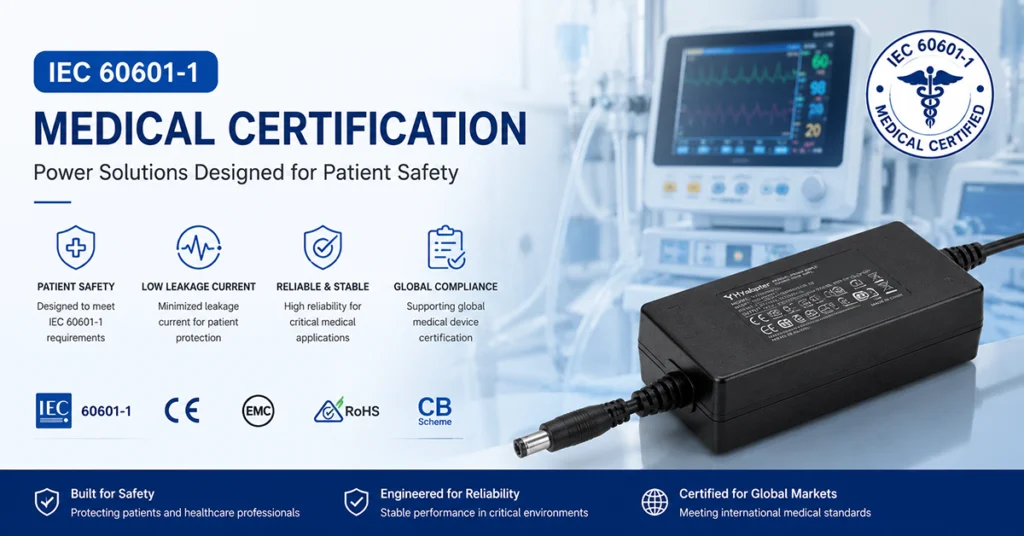
IEC 60601-1 Medical Certification
Medical-grade power adapter certification covering 2×MOPP, leakage current limits, and patient-near safety requirements.
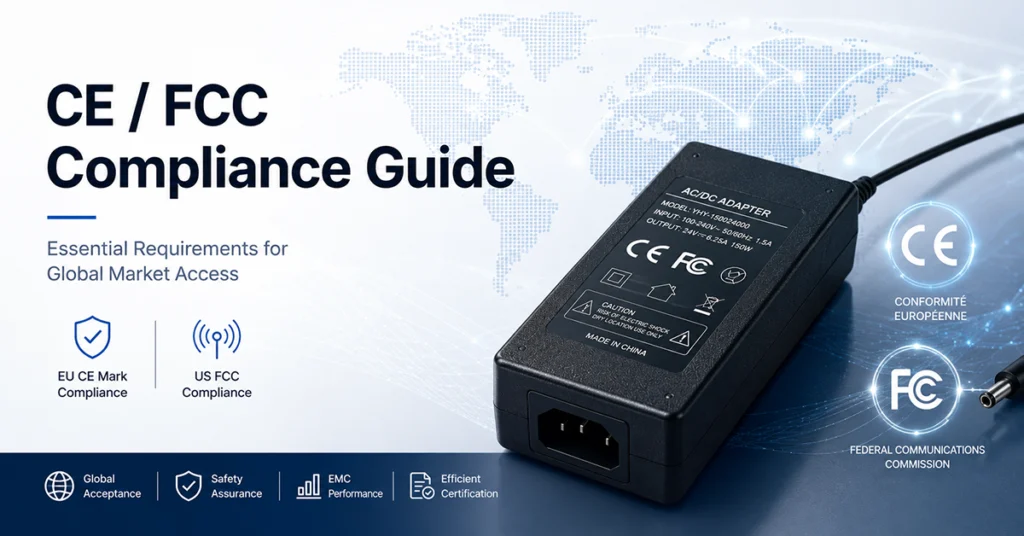
CE / FCC Compliance Guide
EU Declaration of Conformity (LVD + EMC) and FCC Part 15 requirements for power adapters sold in Europe and North America.
FAQ
Q1: What is the difference between “typical” and “maximum” values on a datasheet?
A: “Typical” values represent the average performance measured across a production batch under nominal conditions (25 °C, 230 VAC input, full load). “Maximum” (or “minimum”) values are guaranteed limits that the vendor commits all units will meet over the full operating range. Always design your system to the maximum/minimum values, not the typical ones. A typical ripple spec of 80 mV p-p means little if the maximum allowed is 200 mV p-p and your load is sensitive to noise above 150 mV.
Q2: How do I verify that a certification mark on a datasheet is legitimate?
A: Cross-reference the certificate number on the certifying body’s public database. For UL, use the UL Product iQ database (www.ul.com/iQ). For CE, request the Declaration of Conformity and verify the Notified Body number (if applicable). For CCC, check the CNCA database. If the datasheet shows a certification logo without a certificate number, request one—this is a red flag for counterfeit or expired certifications.
Q3: Can I use a 12 V / 5 A adapter for a load that draws a peak of 6 A for 100 ms?
A: It depends on the adapter’s peak power capability and overload recovery characteristics. Many desktop adapters can deliver 110–130% of rated current for brief periods (milliseconds to seconds) before OCP triggers. However, a constant 6 A draw (120% of rating) will likely cause the adapter to enter hiccup protection or thermal shutdown. Check the datasheet for “peak current” or “power margining” specifications. If none are listed, request a scope capture of the adapter’s transient response at your required pulse profile.
Q4: Why do two adapters with the same voltage and current rating have different ripple specifications?
A: Ripple and noise is highly dependent on measurement methodology—particularly the oscilloscope bandwidth, the type of output termination capacitor, and whether the measurement is taken at the adapter terminals or at the end of a cable. A 150 mV p-p spec measured with 20 MHz bandwidth at the end of a 1 m cable may actually be cleaner than a 100 mV p-p spec measured with 100 MHz bandwidth directly at the adapter output. Always compare measurement conditions, not just the headline number.
Q5: What is hold-up time, and why should I care?
A: Hold-up time is the duration the output remains within regulation after an AC input interruption. Standard external adapters typically specify 10–20 ms at full load and nominal input. If your product needs to save data or perform an orderly shutdown during a power loss (common in medical, industrial control, and networking equipment), you need at least 16 ms hold-up time (one full AC cycle at 60 Hz). Some adapters offer extended hold-up via larger bulk capacitors—check the datasheet for hold-up curves at your load point and input voltage.
Key Takeaways
- Read worst-case (max/min) values, not typical values — typicals are marketing, worst-cases are engineering.
- Derating curves are the single most overlooked specification — always plot your operating point on the vendor’s derating curve.
- Certification marks must be model-specific and verified — do not rely on logos alone; request certificate copies.
- Normalize measurement conditions before comparing datasheets — R&N bandwidth, efficiency test points, and temperature conditions vary by vendor.
- Hold-up time, inrush current, and protection thresholds are as critical as voltage and current ratings for system-level reliability.
- Build a standardized datasheet comparison template to eliminate format-driven bias in vendor selection.
- Request scope captures and test reports for critical parameters in medical, industrial, or safety-intensive applications.
Conclusion: Building Datasheet Literacy into Your Procurement Process
Reading a power supply datasheet is a skill that pays dividends across every stage of product development. A datasheet-literate procurement team catches specification mismatches before prototype, reduces redesign cycles, and selects vendors based on real-world performance rather than headline numbers.
Adopt these three practices in your procurement workflow:
- Create a mandatory parameter checklist. Every datasheet you evaluate should be checked against the same 20+ parameter framework. Deviations or omissions are escalation triggers.
- Request a “worst-case” data supplement. Ask your vendor for efficiency, ripple, and derating data at your specific operating point—not just the nominal conditions on the datasheet.
- Verify certifications independently. Set up a 15-minute certification verification step in your sample approval process. It costs nothing and prevents months of market access delays.
The power supply is the foundation of your OEM product’s electrical system. Treat the datasheet with the rigor it deserves—and your production line will thank you.
- Request a Quote → — Submit your specifications for a detailed quotation
- Talk to an Engineer → — Discuss your technical requirements with our design team
📥 Looking for a practical tool? Download our Datasheet Comparison Checklist — a ready-to-use template with all 20+ parameters covered in this guide.